| Corcoran Technical Trading Patterns For January 8 |
| By Clive Corcoran |
Published
01/8/2010
|
Stocks
|
Unrated
|
|
|
|
Corcoran Technical Trading Patterns For January 8
Many equity charts are proving to be inscrutable at present as the combination of New Year re-positioning plus anticipation of today’s NFP data is creating patterns that are not easily susceptible to interpretation.
Often before the release of such market-moving data it is better to look for opportunities in the forex markets.
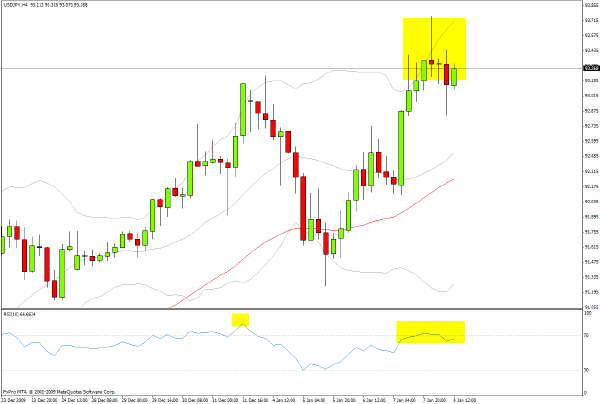
The USD/JPY is positioned at the time of writing on the 4-hour chart at 93.2 (targeted here in mid December) which is in accordance with a trend line of resistance, and there is slight evidence of RSI negative divergence. There is a lot of constructive sentiment building towards Japanese equities - in my own forecast for 2010 I made the case for 12,000 on the Nikkei during this year - and yen weakness would certainly be supportive of this case. However, the gravestone doji in the middle of the highlighted section and other shooting star patterns suggest that there is a lot of overhead resistance to come. This cross rate will be worth monitoring later today when the NFP data is released. A decisive break through the 94 level would set up 97 as an intermediate-term target.
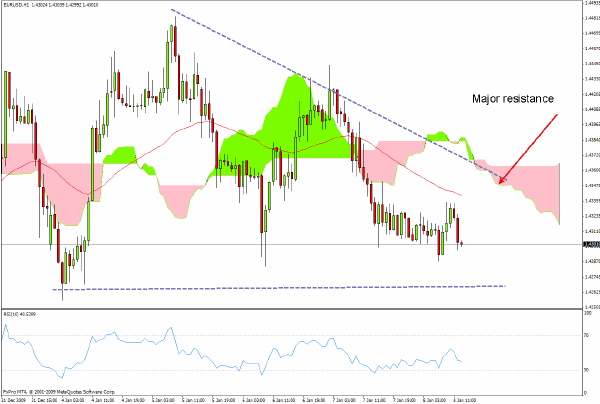
The euro continues to wrestle with poor technical conditions, weaker-than-expected employment data and the ongoing concerns of a two-tier Eurozone with Germany and France exhibiting relative strength while deflationary forces are still engulfing the so called PIGS (Portugal, Ireland, Greece and Spain).
If EUR/USD cannot hold above the January 4 intraday lows around $1.4260 then the next support would lie at the $1.4180 level based on the weekly Ichimoku charts. I suspect that we could be in the $1.30’s before the end of January.
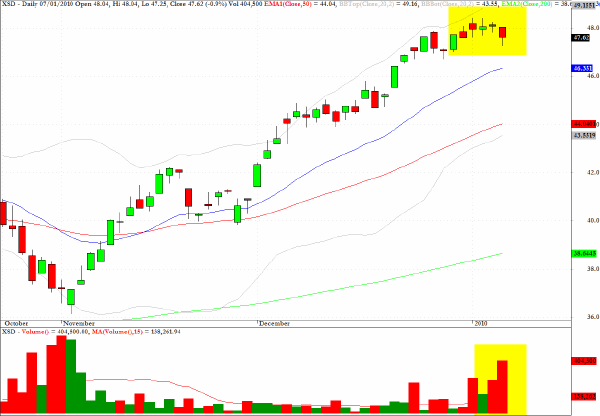
Semiconductor stocks are showing signs of fading momentum and XSD is also showing increasing volume as the MACD chart rolls over.
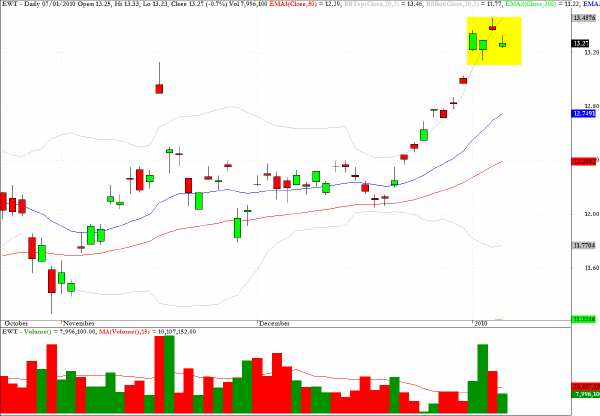
Correlations among ETF’s is a fascinating area for asset allocation strategies and one of the stronger correlations between sectors is between EWT - the MSCI Taiwan fund - and the semiconductors.
The chart pattern on this lightly traded ETF could also be pointing to a tradable correction back to the $12.80 level.
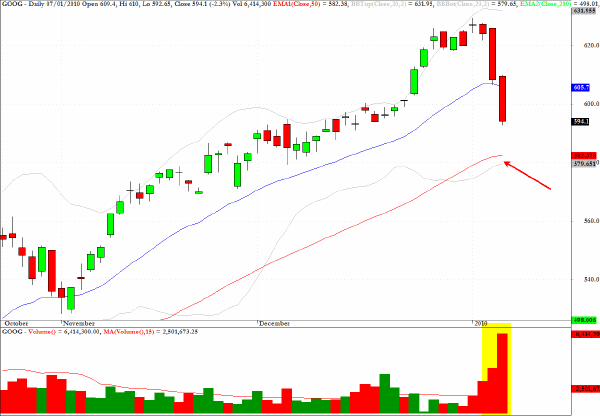
Google (GOOG) is not a stock which I pay very close attention to since it seems that there are many traders and investors that just love the company (somewhat like the situation with Apple) and the chart rarely makes much sense. However, the pattern over the last three sessions looks as though some asset managers are moving out of the stock in a big way. The 50-day EMA is probably the most likely near-term support level.
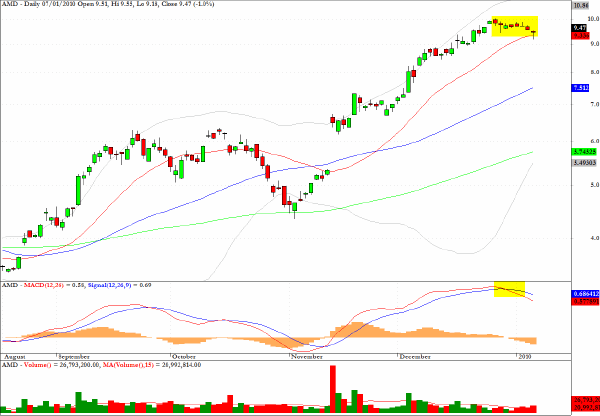
Advanced Micro Devices (AMD) is a constituent of XSD and, unsurprisingly, is displaying similar characteristics to the sector fund.
My final chart today, taken by a NASA satellite, illustrates how the UK is in the grip of extraordinary weather conditions which have virtually brought the country to a standstill.
My actionable target for this graphic would be to head to the airport to catch the next plane to the Caribbean but unfortunately, apart from the fact that the roads are impassable, I have other commitments which will keep me on this frozen island!

Clive Corcoran is the publisher of TradeWithForm.com, which provides daily analysis and commentary on the US stock market.
|