| The McMillan Options Strategist Weekly |
| By Lawrence G. McMillan |
Published
01/8/2010
|
Options
|
Unrated
|
|
|
|
The McMillan Options Strategist Weekly
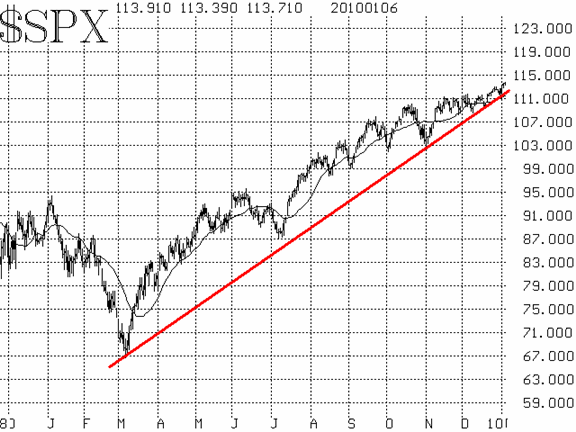
The $SPX chart continues to be positive, as the index remains above its intermediate-term trend line, dating back to the March bottom. The nearest support is at 1115 -- the lows of the selling on the last trading day of 2009. Below that, support at 1100 and then 1085 are important, too.

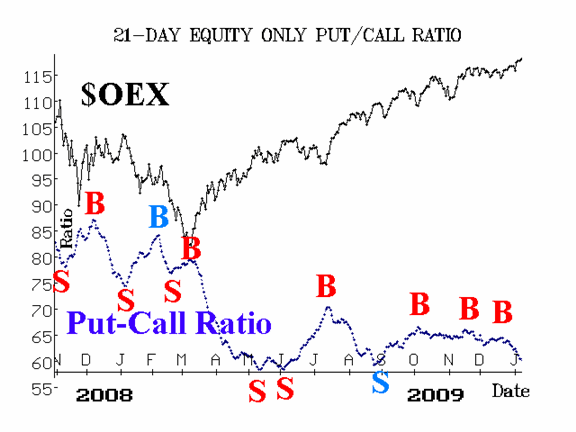
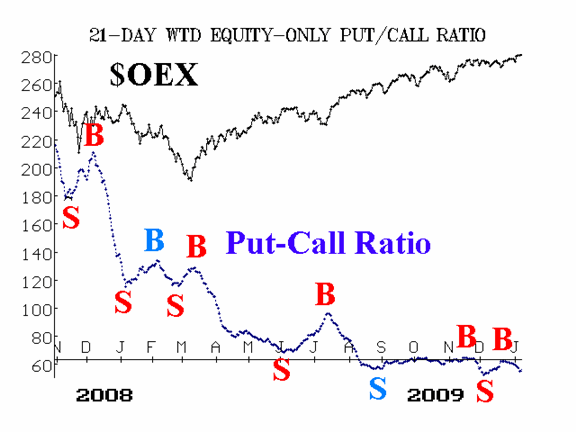
The equity-only put-call ratios, which were ineffective for a long time, seem to be back in synch. They remain on buy signals.

Market breadth has been steadily positive, although not spectacularly so. However, since breadth is overbought, the possibility of a sharp, but short-lived correction is possible at any time.

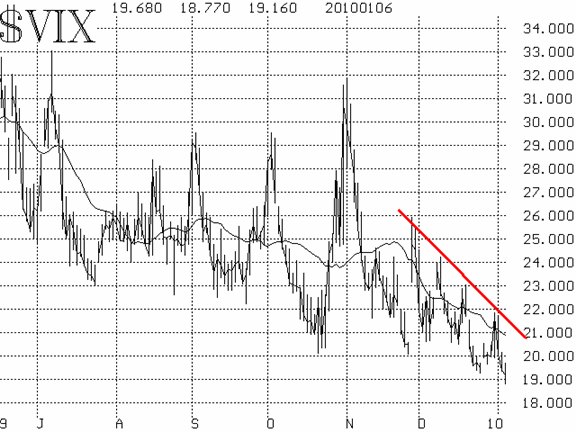
Volatility indices ($VIX and $VXO) have made new lows, trading at prices last seen in August of 2008. The downtrend in $VIX continues (see Figure 4), and that is bullish for the stock market.

In summary, the chart of $SPX is bullish, and the technical indicators support that case. Yes, there are overbought conditions, and we would expect a sharp, but short-lived correction soon. However, unless certain factors change, the bulls remain in charge.
Lawrence G. McMillan is the author of two best selling books on options, including Options as a Strategic Investment, recognized as essential resources for any serious option trader's library.
|