In the past few years, the airlines have been in the business of turning $1,000,000,000 into negative $3,000,000,000. Yes it's true, what comes up must come down. Or should we say what goes up must go completely underground never to emerge? For many airlines, that's the horrible reality. However, we are focused on opportunity, not past problems.
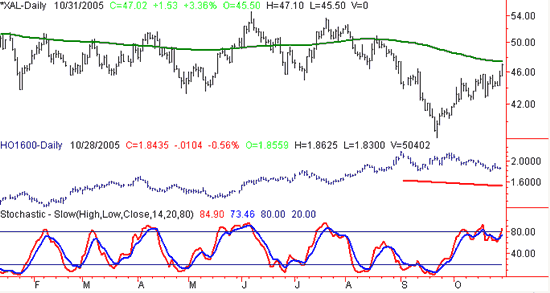
There have been some interesting developments recently with airlines. We knew months ago that what the industry needed was a good old fashioned bankruptcy. That would give the airlines more pricing power and the ability to finally increase fares. Delta and Northwest answered that call recently. On top of that, heating oil futures, which best represent the price of jet fuel, saw a huge drop today and in the last month have reversed sharply from prices above $2. Let's have a look at airline stocks as represented by the Amex Airline Index (XAL). Also heating oil futures are represented in dark blue. XAL is nearing 2 important areas of resistance. First off, the 50 area has been a major area of resistance. Secondly, the stochastic reading on this index, may be ripe for the picking.
AMEX Airlines Index (XAL) - Daily

The stochastic reading has been a useful tool in the conventional way this year. Most people sell when the stochastic hits 80 and buy when it reaches 20. This technique tends to be highly effective when a security is in a trading range. However, it is ineffective when big trends develop. That's where we come in and use it in the opposite way during big moves. You can see that the stochastics gave an oversold reading in the last week of August. The index looked like it would rebound but fell even further all the way below 40. This downward move beginning in August may have ended the trading range for this security. The index is currently in a stronger, and longer trend than before, and that's why we have an eye on it now.
We will ultimately be very bullish if the index crosses over 52, but a move over the 200-day average will be a good start. We're not as intermediate-term bullish on this index because of it's long term downward trend that has lasted for years now. But, keep an eye on that green line as well as the 52-53 mark.
Major Players
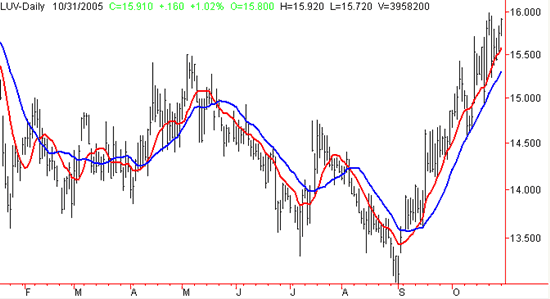
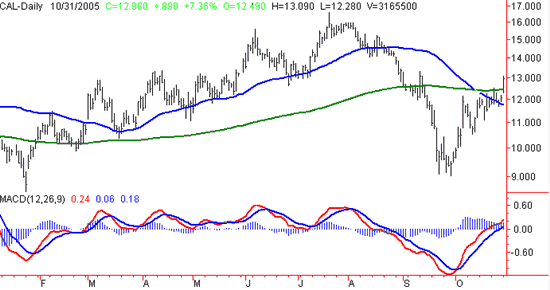
Here are 2 airlines that we are watching closely:
Southwest Airlines

Continental Airlines

Here's what traders should do:
- go bullish on the sector once it CLOSES above the 200-day line
- become even more bullish if the index crosses the 53 mark
- keep an eye on stochastics and heating oil prices
Price Headley is the founder and chief analyst of BigTrends.com.