| Corcoran Technical Trading Patterns For January 21 |
| By Clive Corcoran |
Published
01/21/2010
|
Stocks
|
Unrated
|
|
|
|
Corcoran Technical Trading Patterns For January 21
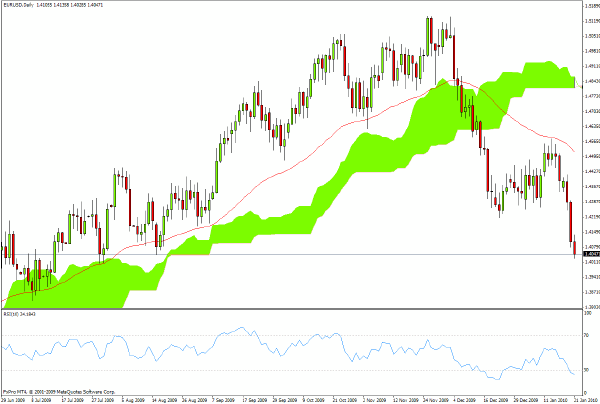
The chart for the euro is beginning to take on the appearance of a waterfall.
Yield spreads with respect to German bunds on Greek, Spanish, Portuguese and Italian sovereign debt are surging and there are growing concerns that the time to pay the piper has arrived. The relaxed manner in which many policy makers continue to talk about how easy it is going to be to finance the gargantuan amounts of sovereign debt that will have to be sold for years to come, is starting to sound about as convincing as promises made about radical change in the US under the slogan "Yes we can".
There are a lot of opportunistic shorts that will scramble to cover as and when there are soothing statements put out by the ECB and Eurozone officials, but in a world which is still massively short the dollar any significant rally in the euro should be seen as a selling opportunity.
$1.38 looks feasible a lot sooner than I thought.

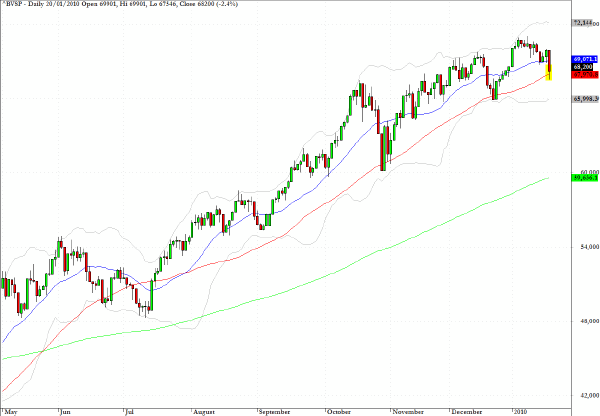
As a followup to my chart on Monday of the Bovespa Index in Brazil and the discussion during an appearance on CNBC’s European Closing Bell that same afternoon, the call on a potential topping-out pattern could be unfolding. The index has fallen back to the 50-day EMA and it will be critical in the next couple of sessions to see whether, as when this has happened previously, the BRIC enthusiasts can rescue the index from what could well turn into a 20% correction as mentioned in Monday’s discussion.

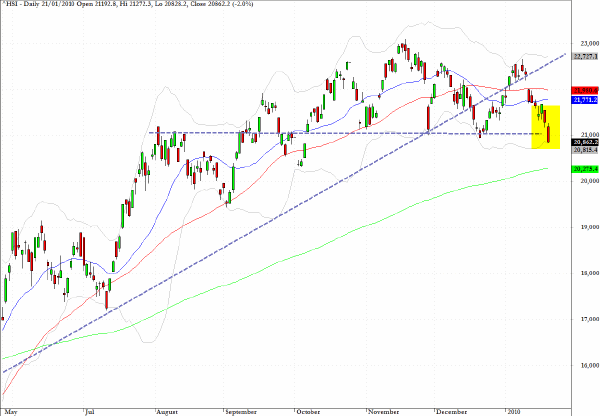
The last two hours of trading saw the Hang Seng Index drop like a stone with a 2% loss for the session.
The 21000 level discussed here yesterday did not provide support and a key trend-line back to the July low has now been violated.
The goldilocks story on the Chinese economy is starting to look somewhat tarnished and the more the Chinese authorities look serious about combating potential inflationary issues (especially domestic asset inflation in the form of ridiculous prices for high end real estate) the more it appears that the punchbowl is being removed from the emerging markets party.

US equities look a little less stretched at present than those just reviewed in the hot money markets of Asia and Latin America.
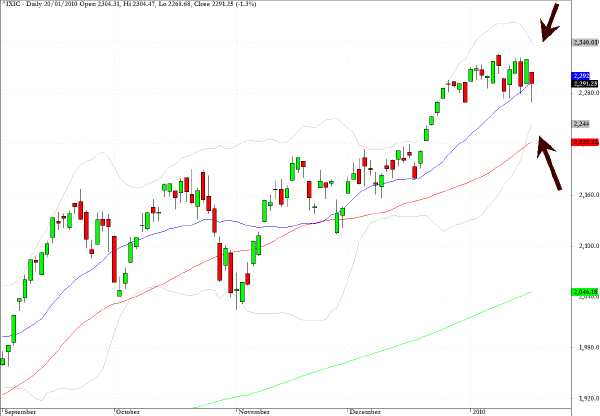
What concerns me somewhat about the chart for Nasdaq Composite Index below is that the volatility bands are constricting suggesting that a large move may be imminent, and given the backdrop of a potential sovereign bond crisis in parts of Europe and a deterioration in sentiment from China, it is slightly problematic to assume that the breakout will be upwards.
However one should never under-estimate the capacity to support current asset values in the US from the powers that be.

Clive Corcoran is the publisher of TradeWithForm.com, which provides daily analysis and commentary on the US stock market.
|