| Corcoran Technical Trading Patterns For January 25 |
| By Clive Corcoran |
Published
01/24/2010
|
Stocks
|
Unrated
|
|
|
|
Corcoran Technical Trading Patterns For January 25
Last week the markets were unsettled by a number of developments ranging from evidence of a tighter monetary policy in China, continuing concerns about Greece and the PIGS in general, but most importantly by the impromptu press briefing from President Obama regarding the Volcker initiative.
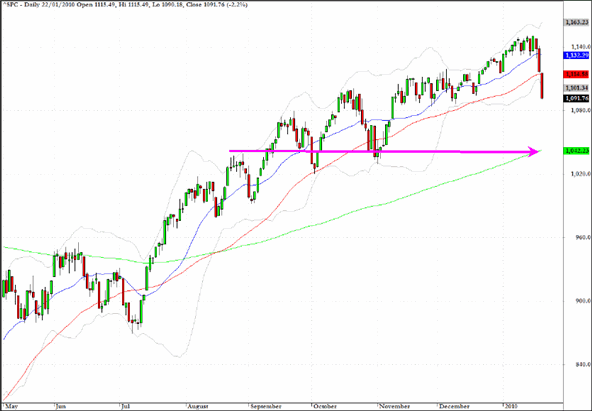
The S&P 500 sold off hard on the week and closed at 1091 which was just six points from the 1085 target which I discussed here last week. As of this writing on Monday morning European time, the Armageddon merchants will have been disappointed to see that Asia and Europe did not go into freefall and I suspect that the reasoning behind this apparent calmness has to do with the fact that Ben Bernanke looks to be secure in terms of his renomination.
Whether the Bernanke reconfirmation is sufficient to maintain a bid for US equities remains to be seen, but there are other technical reasons to suspect that the tide is turning towards a sizable correction. Perhaps most importantly there are, on many charts, failures at retest of late 2009 highs and the selling has been accompanied by much higher volume than the anemic volume patterns witnessed during the drift up in early January.
A plausible scenario in the coming week or two is that we will need to test the 1040 area which as illustrated on the chart is a line of previous support/resistance and also marks the 200-day EMA.
Returning to Obama’s new-found affection for Paul Volcker for one moment, I suspect that no matter how much this initiative gets diluted and that the usual suspects try to circumvent the impact of the restrictions, there will be considerably less proprietary trading by US based institutions. The real measure of success will be whether it causes a wave of restructuring and downsizing among the major banks. If it does it will have achieved a lot.
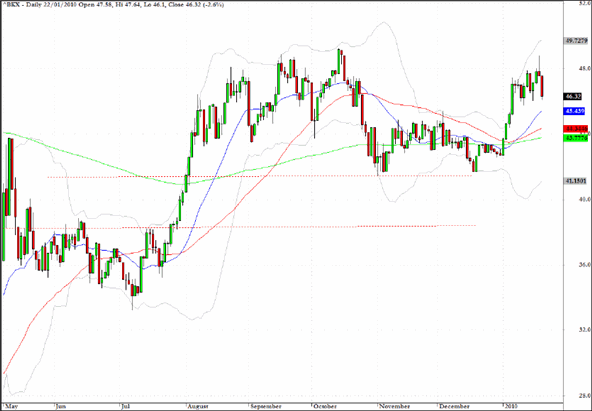
The KBW Banking Index (BKX) failed to break above $49 and registered a shooting star last week. This sets up the potential for a revisit to neckline support around $42.
There is already a huge amount of "noise" developing in the commentary regarding the Volcker initiative and the bankers will clearly want to exploit this to muddy the waters. One wedge that will be used by the banking lobbyists, many of whom are gathering in Davos, Switzerland this week, will be their argument that the US initiative has not been "coordinated" with other G20 nations.
UK press coverage over the weekend about the announcement from Obama last Thursday (especially from Murdoch’s Sunday Times) was keen to point out a "split" between Washington and London over the agenda.
Divide and rule (for the banks) is alive and well!
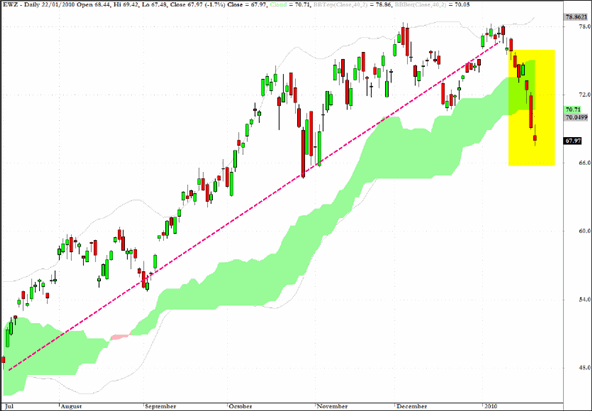
The stripped-down chart below which simply shows the Ichimoku cloud patterns and violation of an obvious trendline dating back to last July’s lows, shows that EWZ, as anticipated here a week ago, is now in a corrective mode that could see a sizable retreat until real buying support emerges.
At first glance the $60 level - which would see a further 10% move down - seems like a feasible target.
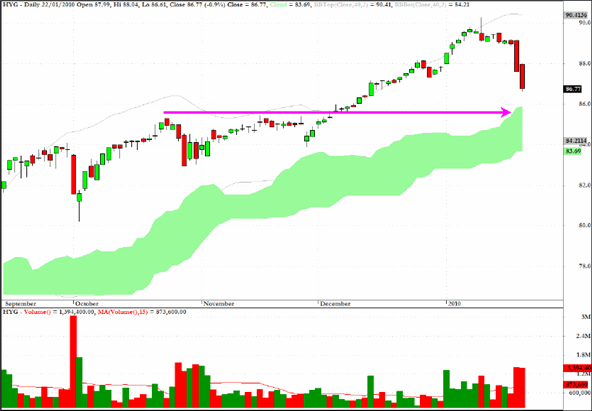
There were a lot of institutional investors and proprietary trading desks exiting the junk bond sector last week, and the sector fund HYG seems set to test the upper and probably lower limits of the cloud formation below.
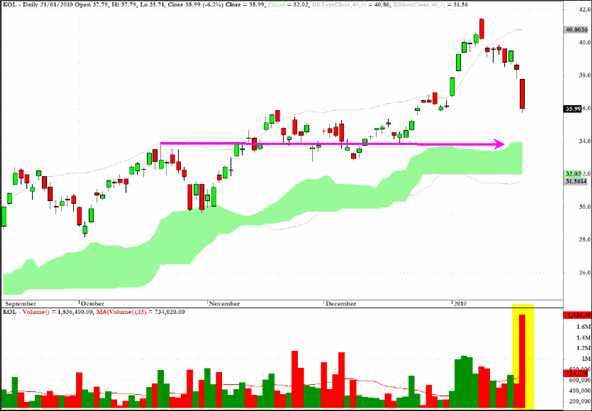
A sector fund for coal related businesses, KOL, could be headed to the $33 level.
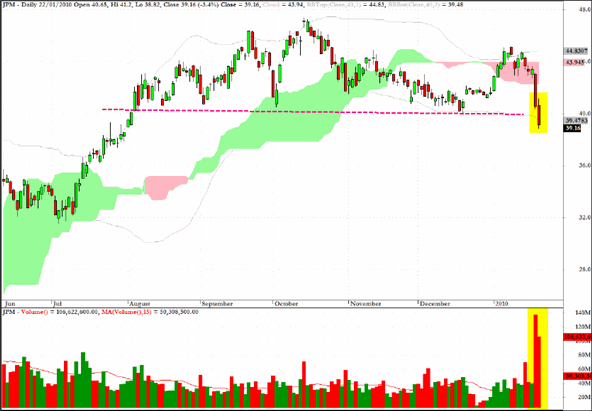
The chart for JP Morgan Chase (JPM) looks decidedly negative and the break of the $40 level on two days of very sizable volume, in conjunction with a pattern which resembles a head and shoulders, suggests that a lot of institutions want out of this sector.
A recent blog posting addresses the issue of the so-called Volcker rule and I include it as background commentary
One of the reasons why the big players like JPM have been so successful at proprietary trading is just the sheer weight of the money that they can play with and their ability to move markets the way they have wanted them to move by aggressive and leveraged position-taking with a safety net supplied courtesy of future generations of US taxpayers.
If the process of splitting off separate trading desks and migration of prop trading to the existing hedge funds proceeds it will result, relatively speaking, with smaller and less strategically vital firms in this area. Somewhat smaller firms will have smaller footprints and will be less able to persuade (and intimidate) other traders into seeing the wisdom of their directional bets.
In addition there may be less appetite from "sophisticated investors" to pledge capital to institutions/funds which are less obviously in the category of "systemically too connected to fail"
If one takes Obama’s relish for a fight with the banks at face value (admittedly not a great idea with any politician!) there is an implicit repudiation of the notion that the taxpayer will bail out further examples of egregious risk taking, and maybe it is better not to spell that out any further.
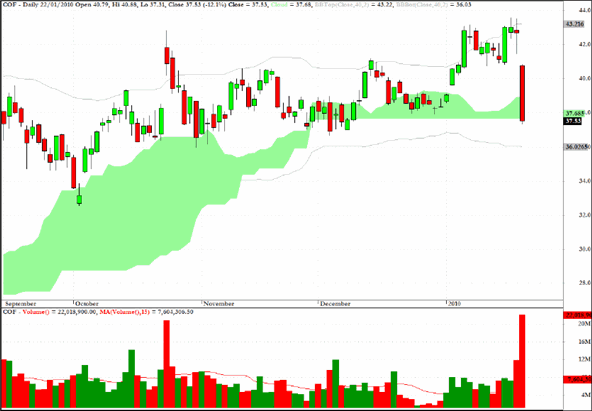
In Friday’s selloff some big casualties other than the banks included companies exposed to the demise of the US consumer and the accompanying write-offs in consumer credit. Apart from American Express one of the uglier charts is the one below for Capital One Financial (COF).
Volume was three times the daily average (based on the last 15 sessions) and the stock lost more than 12%. The peek below the cloud, but with a possible retest suggests that the shorts should be wary in the near term but be watching for further evidence that the support level around $37.50 may be more decisively broken in coming sessions.
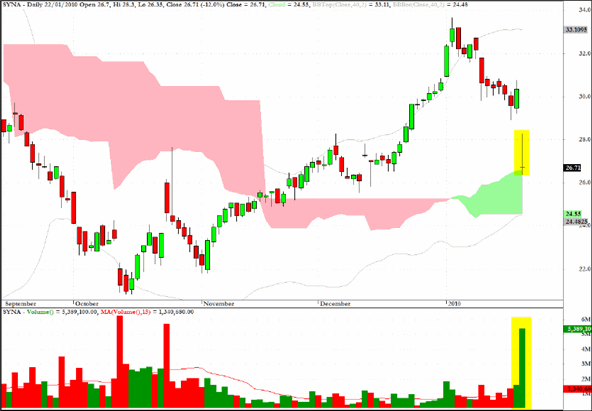
The chart for Synaptics (SYNA) provides an excellent example of a rarely seen candlestick pattern a doji shooting star. If it was close to a multi-period high this pattern would best be described as a gravestone doji but occurring as it does on three time daily volume and coinciding with potential cloud support this could well be a reversal candidate in today’s session.
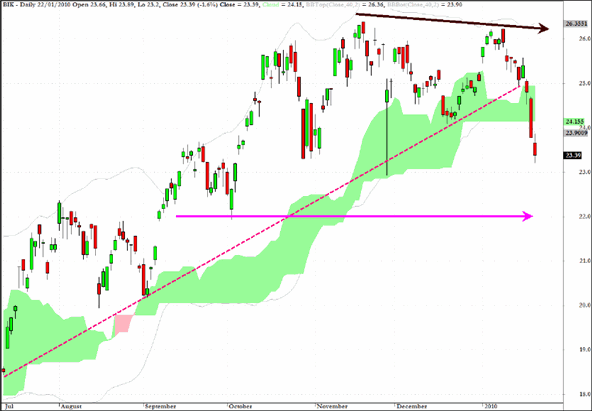
Although I have expressed recently misgivings about the bundling together of such disparate economies as Russia and India under the moniker of the BRIC’s the chart below is compelling in its own right.
Keeping the technical indicators to a minimum and using violation of trendlines and cloud formations as the major signal trigger this sector fund could well see the $22 level in coming sessions.
Clive Corcoran is the publisher of TradeWithForm.com, which provides daily analysis and commentary on the US stock market.
|