| Corcoran Technical Trading Patterns For January 26 |
| By Clive Corcoran |
Published
01/25/2010
|
Stocks
|
Unrated
|
|
|
|
Corcoran Technical Trading Patterns For January 26
Continuing with the theme from last week’s commentaries, amidst all of the hyperbole and noise that has followed in the wake of the Obama/Volcker initiative, there has been a tendency to overlook the consequences for the financial economy of a less accommodating Chinese monetary stance.
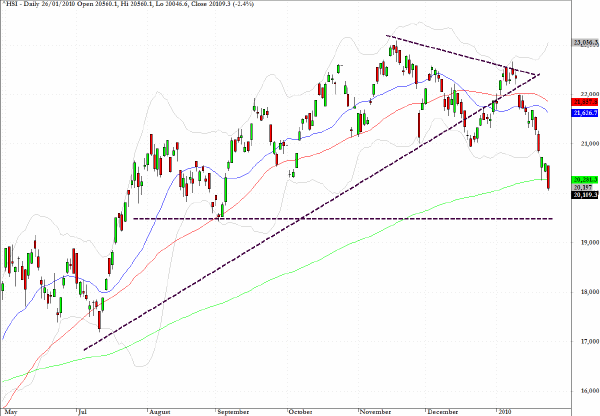
Traders in the Hang Seng have not been so distracted from this and clobbered the index with an almost 500-point or 2.5% fall in Asian trading. Having taken out support at 21,000 there are further layers of minor support at 20,000, but if this does not hold there could be a much nastier fall ahead.
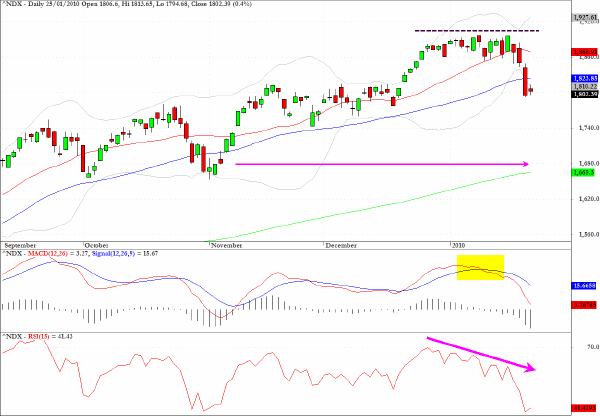
The chart for the Nasdaq Composite (NDX) reveals classic symptoms of negative divergences between price which had reached a plateau and an obviously downward sloping RSI slope with associated weakness and a crossover on the MACD chart. These indicators are not always reliable but notice should be taken of them especially when an index or security is at a multi-period high.
This is one of the technical patterns which I focus on in my TA workshops, more of which are being scheduled during H1, 2010 and for which details will be publicized here in coming weeks.
The FX markets are moving fairly decisively this morning in European trading. Sterling is doing what it does best which is to fall against almost everything after the UK government announced that the country has finally exited its recession but with a disappointing 0.1% growth figure for the last quarter of 2009.
Despite much more cheerful forecasts from many UK economists and pundits the actual number is hardly an occasion for celebration.
The tide appears to be turning in favor of dollar bulls or perhaps more accurately it would be better to say that it is turning against the huge number of dollar bears.
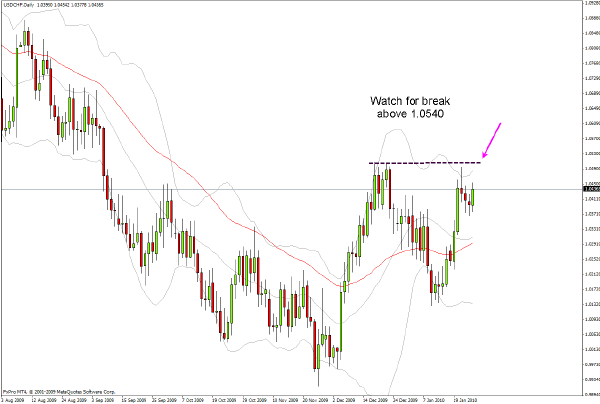
Watch the USD/CHF cross rate for a possible break above 1.0540 which would be a strong buy signal for the US currency against the Swiss Franc.
As commented here before, the exception which could prove the rule for US dollar strength and which underlines the growing risk aversion theme which is now becoming far more visible in inter-market alignments, is the strength of the Japanese yen.
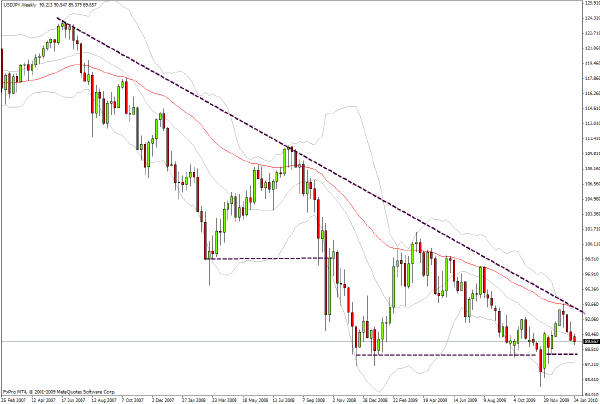
The long-term weekly chart for the USD/JPY pair shows a remarkably persistent descending wedge pattern which is bearish. However, a break above the hypotenuse to the right-angled triangle would be a game changer for this pair, and while I am not predicting it in the immediate future, the yen seems to be increasingly overextended given the poor state of the Japanese public finances and with a negative outlook being registered today by S&P for the sovereign debt of the second largest economy in the world.
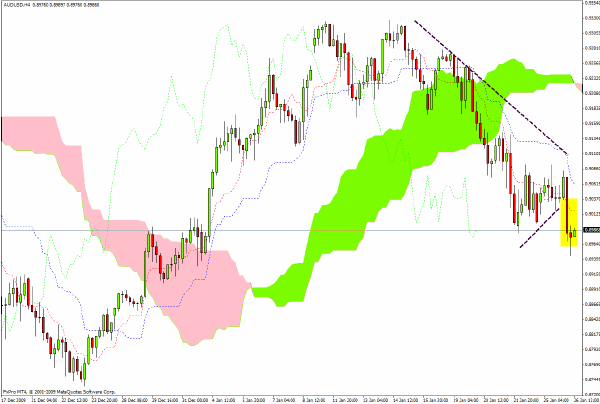
From my twitter account yesterday I alerted that the AUD/USD looked ready to break down from the triangular pattern evident on the chart below. Giving further plausibility to that opinion was the rolling top pattern which is clearly visible on the 240-minute chart. Trading in Asia overnight saw the breakdown occur and yet again the weakness in the Aussie currency underlines the fallout from the Chinese more restrictive monetary policy and the diminution in the appetite for risk assets in general.
A retest of lows seen in December now seems likely.
Clive Corcoran is the publisher of TradeWithForm.com, which provides daily analysis and commentary on the US stock market.
|