| Corcoran Technical Trading Patterns For January 29 |
| By Clive Corcoran |
Published
01/29/2010
|
Stocks
|
Unrated
|
|
|
|
Corcoran Technical Trading Patterns For January 29
One week ago I wrote in this column the following:
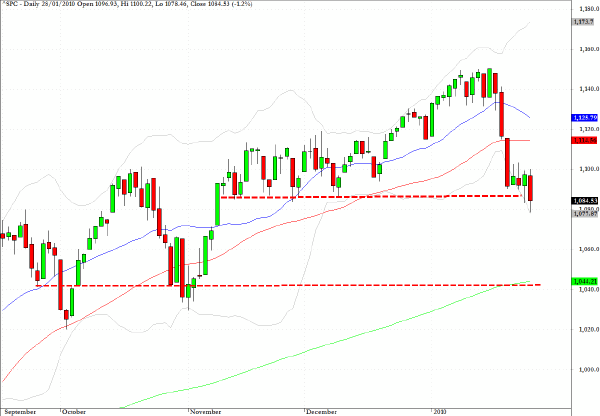
The chart configuration suggests that a followthrough to yesterday’s weakness should eventually lead to a retest of the 1085 level.
The daily commentaries are archived and the actual reference can be found here .
As can be seen from the chart below, we slipped below the 1080 level during yesterday’s session instead of finding a firm bounce at 1080 which would tend to be the case if institutions were keen to keep buying the dips.
I would suggest that the tone of the market is changing and what were once seen as entry opportunities i.e. where the index was approaching areas of support, are no longer acting that way.
There is also other evidence on individual stock chart patterns that traders are looking rather for moves back to resistance as entry opportunities on the short side.
My best estimation is that we could see a rebound from current levels - in order to wash out a lot of the value in the put premiums that fund managers have been willing to pay up over the last few sessions - but once the anxiety has dissipated somewhat and as more upbeat talk about the economic recovery starts to be heard again, the next target for the short sellers will be the 1040 level.
Although I would not place the likelihood as very high, there is a not insignificant chance that the pattern from here could begin to resemble a series of bear flag formations in a downward staircase pattern.

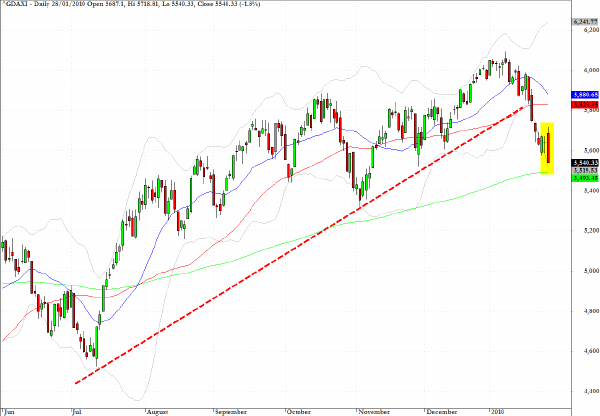
The performance of the DAX index in Germany in many ways characterized the session as I described in my daily blog. There is actually a good graphic of a classic case of "gap and trap" visible on the 15-minute chart.
The 15-minute chart for today’s DAX shows just how easy it is to get stranded when piling into a strong opening gap. Too many intraday punters were anxious to get on board and ride with the feel good factor this morning in European trading. President Obama took a rest from bank bashing in his state of the union speech last night, Asian equities rose overnight and there were plenty of positive vibes about Apple’s iPad.
As a result of yesterday’s performance there is a large red engulfing candle and the index is now 9% from its intraday high registered on January 11th. As a result it seems probable that the bulls may be nervous enough to allow the market to drift back to a re-test the November 27th low, especially as it quite notable that the uptrend line drawn on the chart has been clearly violated.

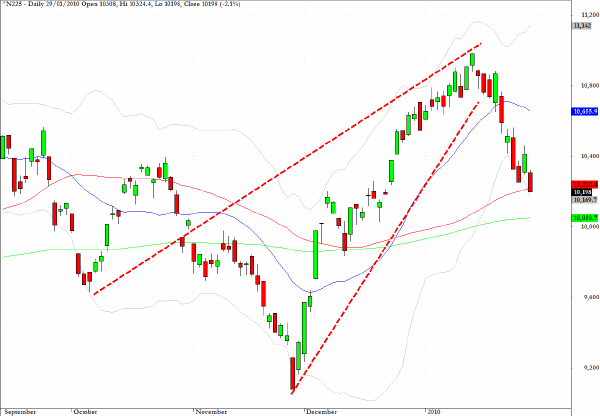
In Asian trading the Nikkei 225 gave back more than 2%.
The chart reveals that the dynamics which were largely government sponsored of supporting the Japanese markets (bond and equities) when the Nikkei looked perilously like slicing through the critical 9000 level in November may not be gaining as much traction as hoped.
The current level looks to be fairly well supported but the drop out of the rising wedge pattern is cause for concern as is the tendency of the yen to rise against the dollar when risk aversion moves back to center stage as it has been doing this week.

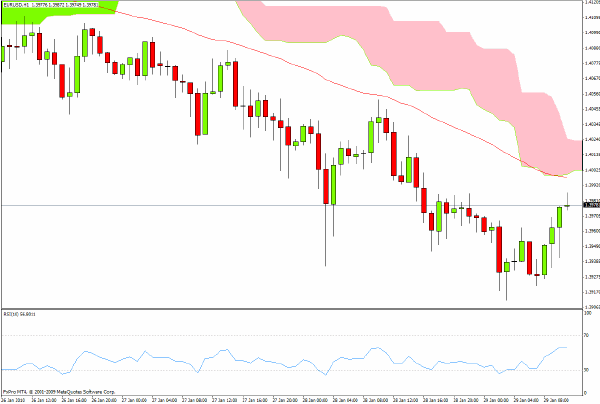
The euro has spent the last 24 hours below the $1.40 level which had previously acted as a psychological support level, even though technically it was less critical than the $1.4180 level discussed here recently.
As the intraday chart reveals the Eurozone currency is now finding that rising above the 50 period EMA - the red line on the chart - and the Ichimoku cloud formation is proving to be a major hurdle.
If, as I suspect, we can make it back above the $1.40 level and even make progress, $1.4160 would present a good entry opportunity for the short side with an eventual target of $1.3820.

Clive Corcoran is the publisher of TradeWithForm.com, which provides daily analysis and commentary on the US stock market.
|