| Corcoran Technical Trading Patterns For February 1 |
| By Clive Corcoran |
Published
01/31/2010
|
Stocks
|
Unrated
|
|
|
|
Corcoran Technical Trading Patterns For February 1
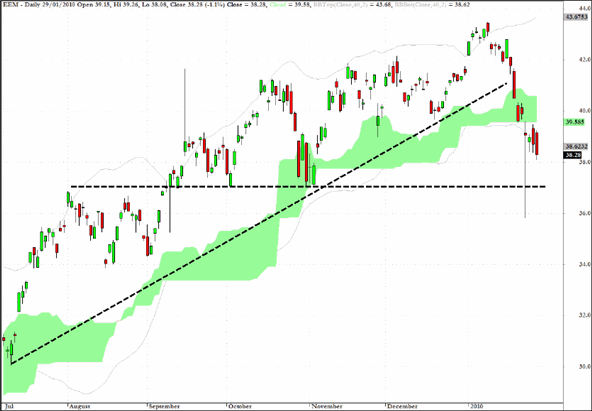
The MSCI Emerging Markets Index is available for trading purposes via the exchange traded fund EEM.
Using the simplest technical analysis tools available - the clear violation of the upward sloping line from the July lows and the drop below the green cloud formation - this chart indicates that a correction is under way for the emerging markets.
I have indicated a level where support should be solid in the intermediate term at which point the longer-term outlook for this sector will become clearer. Much depends on the state of the carry trade and the AUD/USD and also AUD/JPY cross rates.
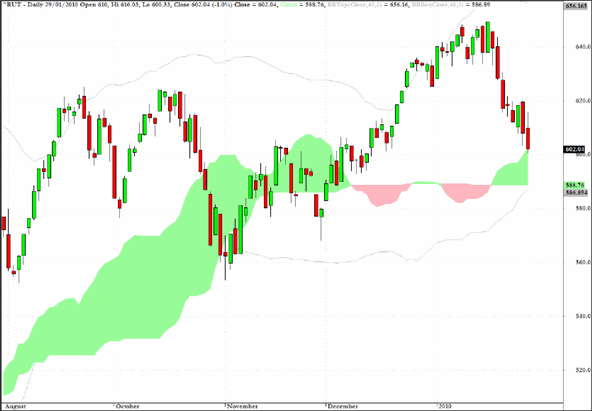
Given Friday’s weakness following "better than expected GDP numbers, the market appears to be spooked by the possibility of a tighter monetary policy ahead, among other worries, but my estimation is that US equities may find a relief rally today. The Russell 2000 touched the 600 level in Friday’s trading and the intuition is that the 585 level which marks both the base of the green cloud as well as the lower Bollinger band may be tested for support. From this I would anticipate the development of a bearish flag formation, as I do not believe that the correction has run its course.
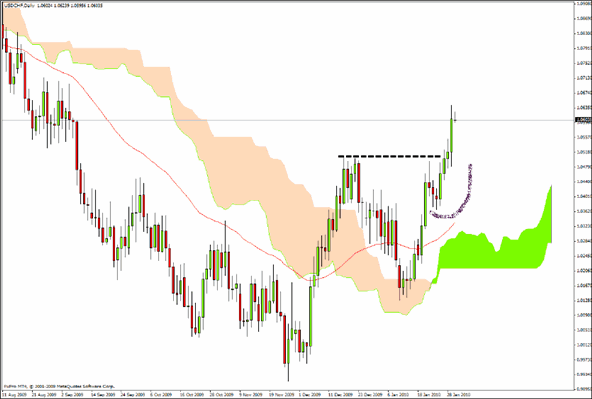
Exactly as anticipated in comments made here last week, the US dollar eventually moved up abruptly against the Swiss Franc after penetrating the 1.0550 region.
The signal which alerted to the breakout was the tiny handle formation which is illustrated on the chart, and characteristically for this formation it showed that the shorts were expecting to break back below $1.05 whereas the momentum players had the stronger hand and were about to take control of the agenda.
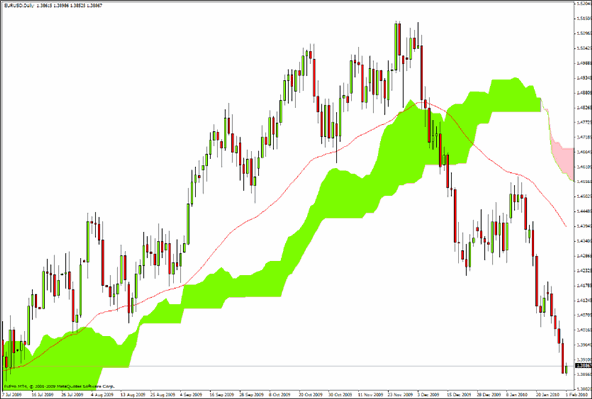
The euro came within 20 pips of the forecast level of $1.3820 in Asian trading on Monday.
A short term rally would not be surprising from this level of support.
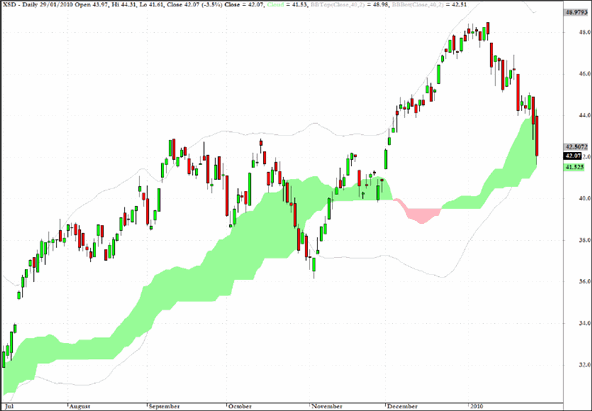
XSD, an exchange traded fund which tracks the semiconductor sector, may have come down to a level of buying support after its rather severe recent sell-off
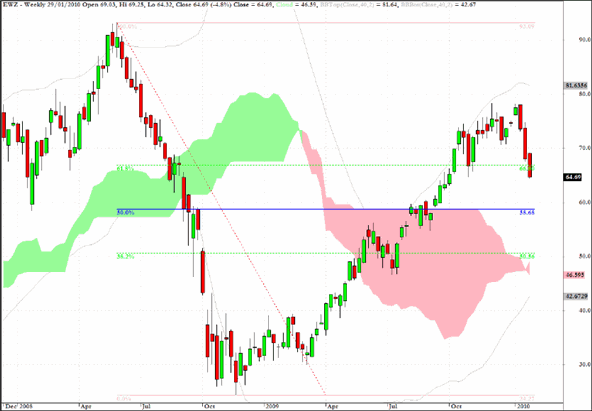
EWZ, the sector fund which tracks the MSCI Brazil Index, having broken below the green cloud formation and the trend-line is now, according to my criteria, in an intermediate term corrective mode.
A support line, coinciding with a 50% retracement of the high/lows seen on the chart, where a meaningful rally could be expected to arise is indicated on the chart.
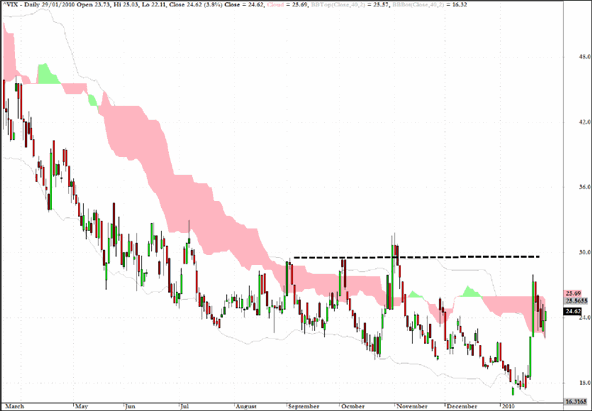
The VIX is displaying an evolving bullish flag (developing within the pink cloud formation) and the expectation is that, while the market convulses over its near term direction, I would be looking for VIX values again to reach back towards the 30 level.
Clive Corcoran is the publisher of TradeWithForm.com, which provides daily analysis and commentary on the US stock market.
|