NASDAQ COMMENTARY
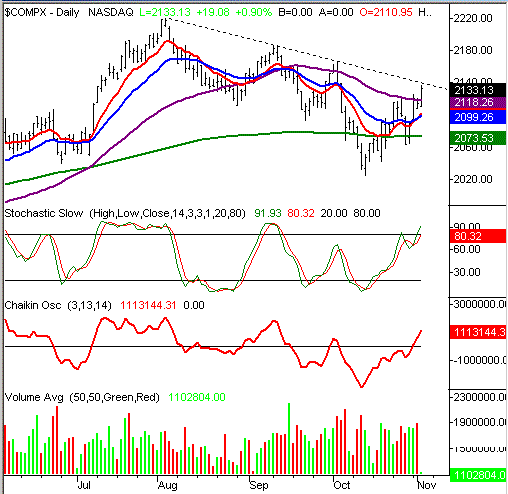
After a brief pause at the 50 day moving average yesterday (and Monday), the NASDAQ Composite finally managed to move well above it. Today's high of 2134.76 is 16 points above the 50 day line (purple) and also a new high for the week. This is one of the key breakthroughs we were discussing in the Weekly Market Outlook, but there's still one more we'd like to see before getting exuberant. That barrier is the straight-line resistance (dashed) that's looming just above where we are now. However, based on what we see as of today, we have to think that ceiling will be topped as well.
With the exception of that resistance line, we're generally bullish. We've obviously already crossed the 10 and 20 day moving averages, so our short-term outlook was already optimistic. And don't forget, we were also on the wake of a bullish MACD crossover. Since the last look, we've added a bullish Chaikin line cross too, with the volume behind this recent surge increasing as it went along (making yesterday's distribution day an oddity). The point is, that's an awful lot of buy signals, and we're going to take them at face value.
Assuming we can get past that last resistance line at 2140, we're targeting a move at least back up to this year's high of 2220. That 3.7 percent gain makes for a pretty aggressive outlook, but don't forget that we're now in the beginning of the most bullish period of the year. As for support, we're still watching the 50 day line closely, so be wary of any close under 2118. But the actual support level we're applying is the 10/20 day line, right around 2100.
NASDAQ CHART - DAILY

S&P 500 COMMENTARY
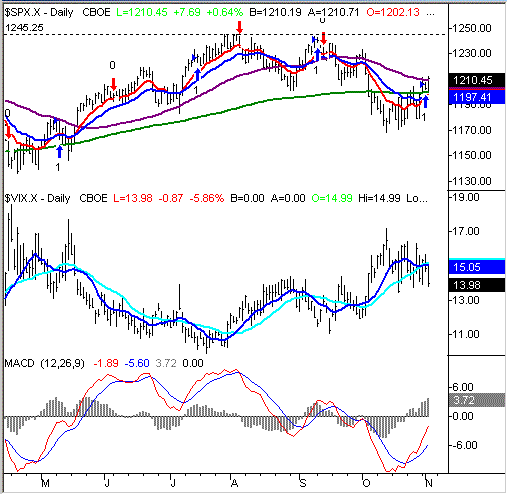
The S&P 500 chart pretty well mirrors the NASDAQ's. The large-cap index is above the 50 day line today, for the first time in a long time, and it's certainly got a lot of upside momentum. So, the outlook here is bullish as well. In the case of the SPX though, the recent cross above the combined 10,20, and 200 day lines (all around 1200) had us bullish anyway. We think the impending rally could be particularly big.
Rather than repeat ourselves, we'd like to take a bit of different point of view with the S&P 500 chart, by adding the VIX to our graph. As most readers will know, we follow it on a regular basis as a sentiment indicator. Normally we'd apply Bollinger Bands to the VIX to highlight instances when it hits extremes....and was prone to a reversal. This time, though, we'd like to apply a different tool. The two lines you see on the VIX chart are a 10 day (dark blue) and 20 day (light) moving average. What we're looking for is just a simple moving average crossover. As you can see, when the VIX's 20 day line falls under the 50 day line, it's bullish for stocks. Conversely, when the 10 day line crosses above the 20 day line, it's bullish for stocks. The long (bullish) entries and exits appear on the S&P's portion of the chart with blue and red arrows, respectively. As you can see, it's worth watching. And more specifically, it's worth watching right now - we just got another buy signal.
(Note: Don't get caught up in these specific moving averages of the VIX. The point is just that the VIX is now technically trending lower. If you're trying to reproduce this VIX-based signal, you may find that there are better moving averages to use. In fact, we usually use slightly different moving averages than these.)
Aside from that, we've also got a bullish MACD crossover here.
As with the NASDAQ, it's hard to argue with the sheer number of buy signals, so we won't. We'll just point out that the S&P 500 has topped out around 1245 twice this year. That's where we'll set our initial target. As for support, keep an eye on 1200. That's where three major moving averages are converged, and it's an important psychological floor as well.
S&P 500 CHART - DAILY

DOW JONES INDUSTRIAL AVERAGE
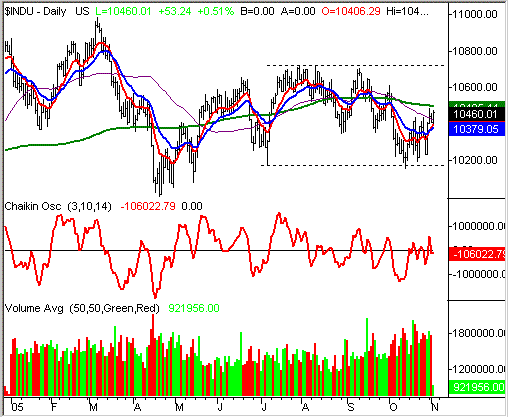
The Dow has been the outlier for most of the year, so why would this week be any different? Unlike the rest of the market, the Dow is still under its 200 day line. So, from a technical perspective, this index seems like it's going to lag the others once this fourth-quarter rally takes off. That's not really a big surprise though - the year end strength is typically led by tech and the NASDAQ, and often at the expense of the big blue chips.
That said, the Dow has moved above the 10 and 20 day line, and even the 50 day line as of today. So from a short-term perspective, we still have to be optimistic here....we just don't think it will be the most bullish place to be.
In fact, unless the Dow can get above its 200 day line at 10,495, you may not want to be here at all. Odds are that the market-wide bullishness will drag the Dow up with it, but the gains will still be sluggish. We'll set a similar short-term target for the Dow, in that we see resistance above at August's and September's highs around 10,700. The key difference here is that those peaks weren't the Dow's highs for the year - which is yet another testament to the relative weakness these 30 stocks are suffering from. Note that there really hasn't been much of a volume trend. That's why this index really can't get anything going - not enough buyers.
Support is at 10360.
DOW JONES INDUSTRIAL AVERAGE CHART

Price Headley is the founder and chief analyst of BigTrends.com.