| Corcoran Technical Trading Patterns For February 2 |
| By Clive Corcoran |
Published
02/2/2010
|
Stocks
|
Unrated
|
|
|
|
Corcoran Technical Trading Patterns For February 2
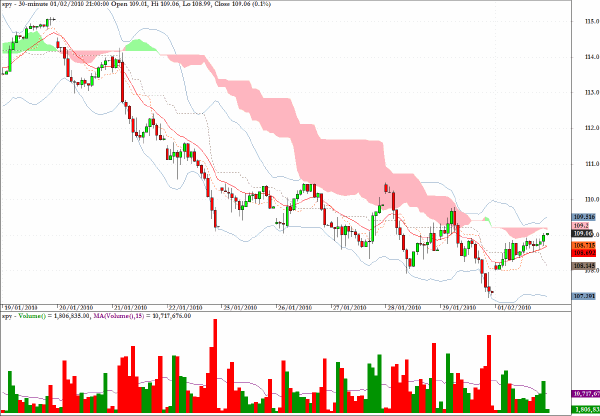
The intraday chart below for the S&P 500 proxy SPY illustrates how useful the Ichimoku cloud formation can be in anticipating points of resistance. The 30-minute chart shows that once the index broke below the cloud pattern on the left hand side of the chart, all of the attempted rallies met resistance at the cloud formation.
Needless to say, this is not fundamentally bullish behavior and underlines my concern that the respite from selling seen in yesterday’s session is not likely to be sustained.
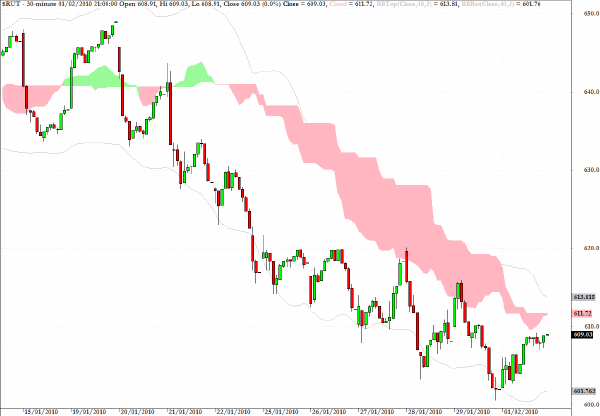
The second chart for today’s commentary reinforces the point made above with respect to the Russell 2000 Index which, once again using the 30-minute time frame, would provide a very effective way of scalping in the small cap sector using the exchange traded proxy for this index, IWM.
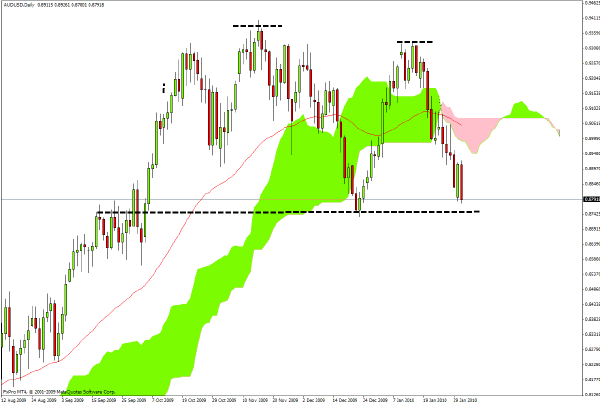
In trading in Asia, the Hang Seng Index barely budged while the Nikkei managed to gain a little more than one percent. In the FX market the Australian dollar is now being pressured at a critical support level, and apart from the technical weakness - as exemplified by the second lower top indicated on the chart - there was surprise from traders that the Australian central bank kept its short term rates at 3.75% whereas a 25 basis point increase was expected.
From my perspective, this is providing increasing evidence of the rolling back of the carry trade, and as the underlying tone of other markets is still suggesting that risk aversion and volatility lie ahead, there would some benefit in monitoring this currency pair today. The key level which could be used as a sell stop would be a break below 0.8700.
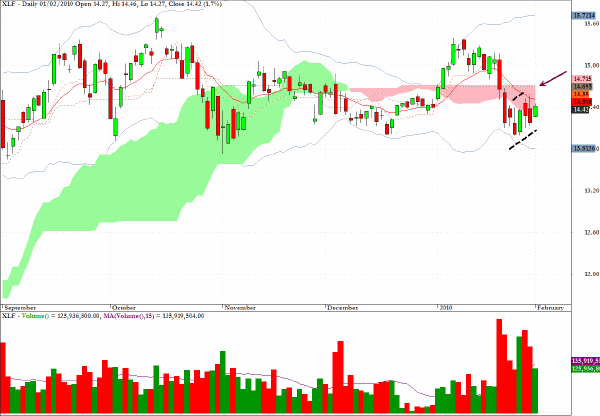
The exchange traded fund XLF, which tracks the financial services sector, appears to be developing a bearish looking flag/pullback pattern. The volume characteristics indicate that the heavy volume sessions are those where the fund is selling off and the rebound patterns are accompanied by lighter volume.
The suggestion is that a short position with a relatively tight stop would be favorably positoned if XLF drops decisively out of the cloud formation today.
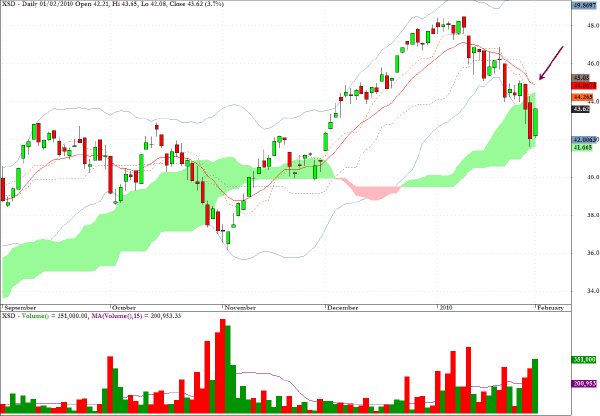
In yesterday’s commentary I pointed to XSD, an exchange traded fund which tracks the semiconductor sector, and suggested that a rally seemed imminent. It would have been possible to realize a return of more than 3% from an intraday scalp after buying yesterday’s open.
Another way to play this trade would be to have taken 50% out of the trade about mid way through the cloud pattern, leaving the other fifty percent in the trade with a target of the top of the cloud and raising the stop loss level on that remaining half position to just below the exit level on the first half.
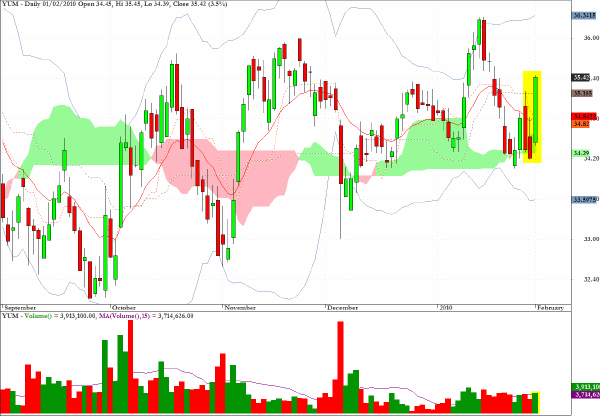
YUM looks constructive on the long side and another attempt to break above the recent highs could be on the table in coming sessions.
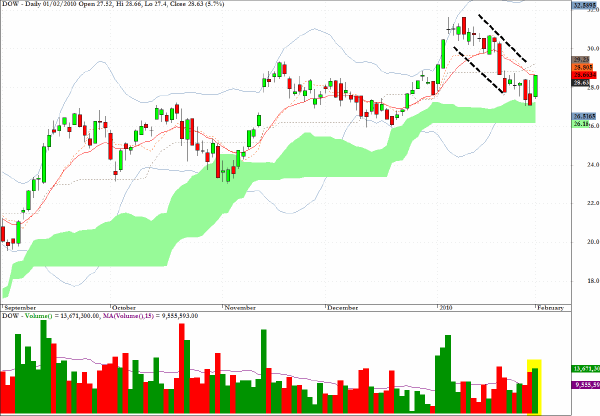
Dow Chemicals (DOW) also presents an interesting setup on the long side with evidence of an extended flag and the appropriate volume and cloud support characteristics.
Clive Corcoran is the publisher of TradeWithForm.com, which provides daily analysis and commentary on the US stock market.
|