| Corcoran Technical Trading Patterns For February 5 |
| By Clive Corcoran |
Published
02/4/2010
|
Stocks
|
Unrated
|
|
|
|
Corcoran Technical Trading Patterns For February 5
Yesterday’s selloff has brought back the kind of fear which was seen in the fourth quarter of 2008. There is a growing unease about the integrity of the Eurozone and the sovereign debt of the PIGS countries. Credit default swap rates on Portuguese and Spanish debt surged, Greece appears to be headed into a period of internal mayhem with national strikes, and the euro continued its virtual free-fall against the dollar. But having said that, sterling also was under pressure as was the Australian dollar and neither of those countries are part of the EZ.
As anticipated here, the US dollar is now becoming the beneficiary of the flight to safety (as also is the Japanese yen) and the ratcheting up of the risk aversion is causing many risk assets to plunge.
Yesterday was also a reminder that markets are far from the rational discounting mechanisms pre-supposed by the Efficient Markets Hypothesis and rather illustrated how the exit from recently loved asset classes is disorderly and predicated on fear and anxiety rather than any rational assessment of changed circumstances.
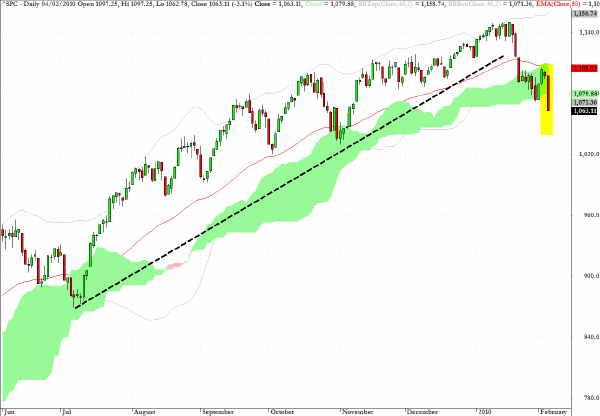
The S&P 500 has now clearly broken below key trendlines and closed substantially below the green cloud formation. With the release of the NFP data, the markets are likely to be quite erratic and there may well be a sudden spike upwards today, but my intuition is that the so-called "smart money" is now looking for rallies to sell rather than dips to buy.
The 1030-1040 area has some significant support but in coming weeks there is good reason to believe that we shall see the S&P 500 back below 1000.
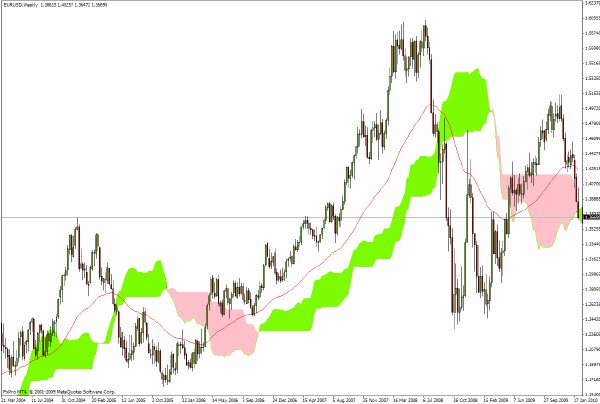
EUR/USD has kept up its relentless downward trajectory and keeps taking out previous support levels.
The long-term weekly chart below shows that the $1.36 level could provide some support but the deterioration in the economic conditions of the Club Med countries is not going away any time soon. More adventurous position traders, who are not so concerned about sharp counter-trend rallies, should also be contemplating a return of the euro towards the $1.28 level within the next few weeks.
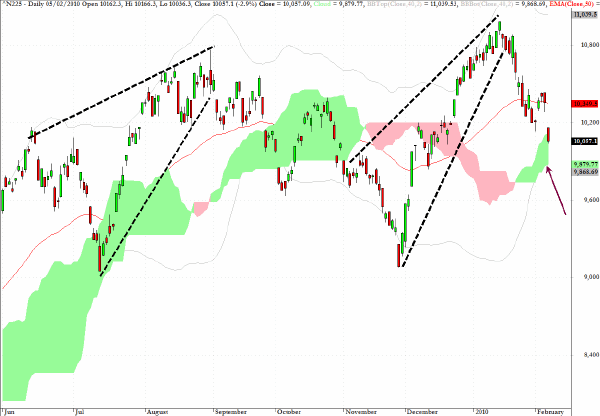
The Nikkei 225 dropped by almost three percent in Asian trading. The twin rising wedge formations are now casting a rather ominous view of this index, which I still believe will tend to be the least correlated with the North American/European equity markets.
Needless to say, any failure at a third test of the 9000 level would be very negative for this market and I suspect that the Japanese central bank will do its utmost to protect this key level. With Japan having a debt/GDP ratio of about 250%, by far the highest percentage of any G20 countries, the aftermath of a sovereign debt crisis in Japan would make the current woes of Greece and Spain seem like a minor glitch in the world’s financial system.
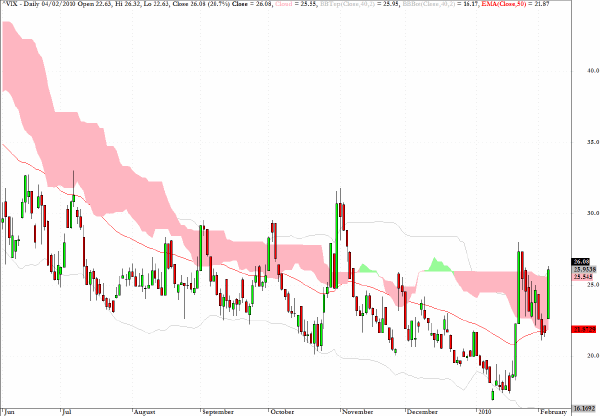
I have previously referenced my contributions to Cantos TV this week and in one of the episodes I also commented on the CBOE Volatility Index - better known as the VIX. As discussed, the previous spikes up in this index in Q4, 2009 were very quickly faded whereas the current spike has shown a far more enduring quality and underlines my concern that the next few months are likely to see much enhanced turbulence in the capital markets.
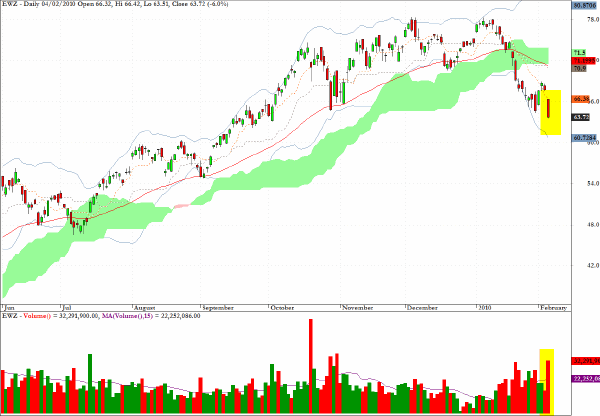
Readers will recall that I have been expecting EWZ, the sector fund which tracks the MSCI Brazil Index, to correct by 15-20% and the chart below shows that the index is now in a dangerous no man’s land where the uptrend is broken and the steep ascent shows that there are no obvious areas of chart support.
As the FX carry trade unwinds and the retreat from risk asset continues, this index looks quite exposed on the downside.
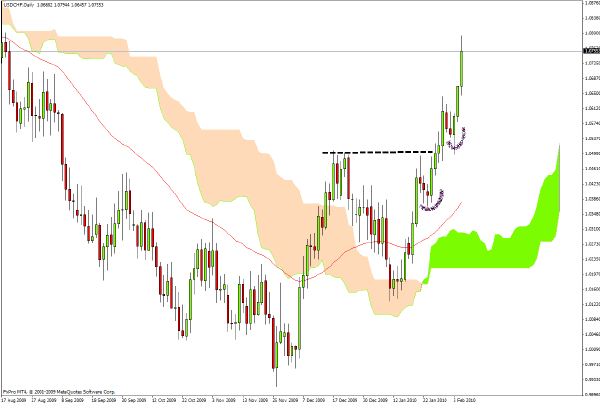
USD/CHF has broken quickly to the 1.07 level after taking out the 1.055 level discussed here recently. The Swiss authorities are thought to be trying to support the euro and are always vigilant on the EUR/CHF cross rate, so there could be some abrupt moves in all of these cross rates - and a short-term scalping approach would be the preferred stance over the next few sessions.
Longer term, as I also discussed in a recent appearance on Cantos TV, the direction of the Swiss currency is now bearish against the US dollar.
Also, although I have not included the chart for the AUD/USD, the pair took out the 0.87 level and the trend for this key carry trade pair has now changed - such that rallies in the Aussie dollar should be seen as selling opportunities.
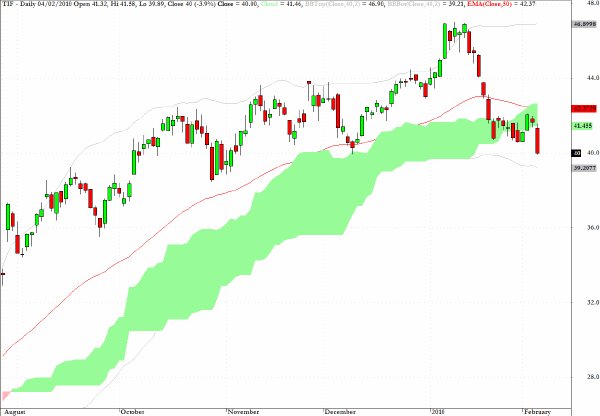
Tiffany (TIF), discussed here in Tuesday’s column as a short candidate, has like so many charts broken below support levels and most especially lost contention with the green cloud above.
As with other technical levels, once a cloud fails to provide support it then will have a tendency to become a level of resistance.
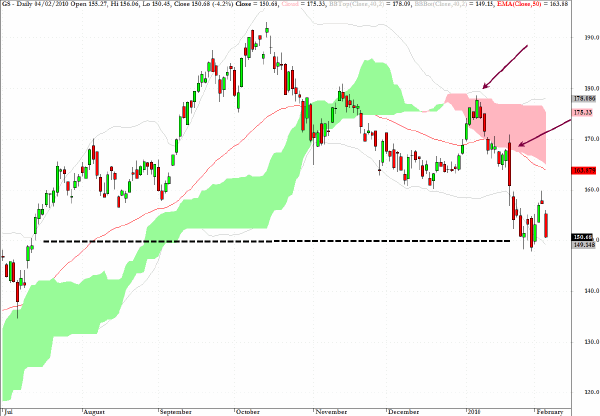
Goldman Sachs (GS) is facing a key support level in the region of $150 with some recent closes below this level. This useful barometer stock should be monitored closely for further weakness as it will provide signals as to sentiment regarding the global financial economy.
The two arrows inserted on the chart show how the Ichimoku cloud formation could have provided some very useful clues as to where rallies would run out of steam. There is also the suggestion that the $160 level will prove to be one where there is a strong possibility of overhead supply and rejection.
Increasingly, investors are sensing that the real economy has disconnected from the financial economy but with more evidence of an anemic recovery on main street (even if that main street is in Spain, the UK or the US) and when this is combined with concerns about sovereign defaults, the chance of another perfect storm causing havoc in the capital markets is rising.
I made this comment in my newsletter dated December 16, 2009.
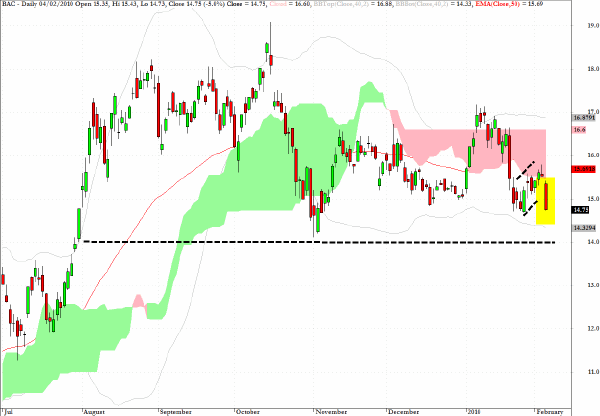
Bank of America (BAC) is continuing to slide back towards my initial target at the $14 level.
It is worth examining this chart as the bearish pullback pattern ran into resistance almost exactly at the perimeter of the pink cloud formation and yesterday’s drop of five percent suggests that the next obvious target is the late October 2009 low just above $14.
Clive Corcoran is the publisher of TradeWithForm.com, which provides daily analysis and commentary on the US stock market.
|