| Corcoran Technical Trading Patterns For February 8 |
| By Clive Corcoran |
Published
02/8/2010
|
Stocks
|
Unrated
|
|
|
|
Corcoran Technical Trading Patterns For February 8
Friday’s NFP data did little to re-energize the bullish case that the US economy is on its way to a robust recovery. The drop in the percentage of the labor force that are unemployed only drew attention to the fact that there are hundreds of thousands who are so discouraged from looking for work that they have been removed from the statistical value placed on the labor force.
There was a rather sharp reversal in the latter part of trading in North America but one suspects that this was the result of short covering by the more enthusiastic bears.
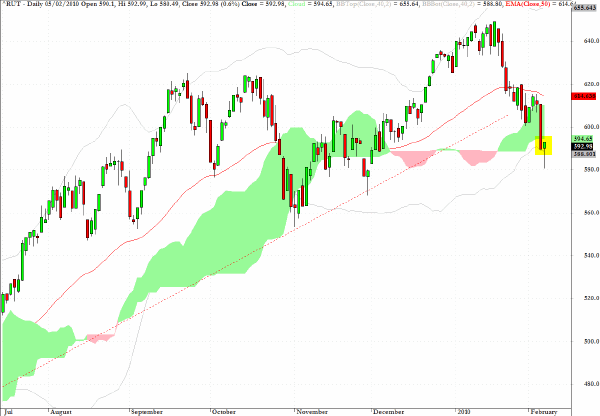
The Russell 2000 headed down below the 585 level which I had referenced here in my commentaries but managed to finish with a close at 592.
In Asian trading the Nikkei 225 closed down by about 1% while the Hong Kong index remains below the 20,000 level but with a more modest loss. In European trading sterling is being pressured and the euro remains below $1.37 and I shall be watching for a close below $1.35 in coming sessions which would accelerate the chances of reaching my longer term target of $1.28 sooner rather than later.
Returning to the outlook for US equities, the risk at this point is that the severe correction that has taken place since the second half of January will now lead to a muted recovery effort where it is quite probable that the pattern that will emerge, in the wake of the many hammer candlestick patterns in evidence, is likely to be a bearish pullback or flag formation on subdued volume.
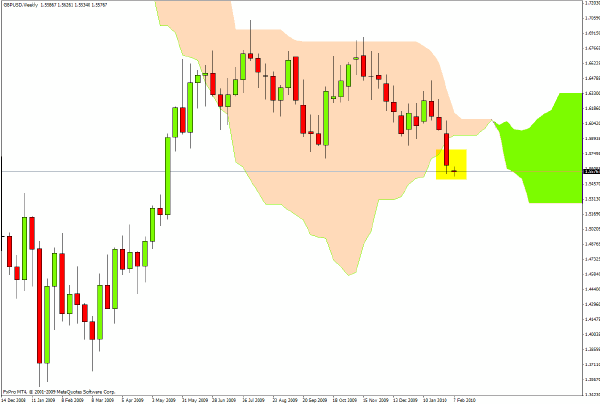
Reviewing the FX charts this morning, the one which has the most capacity to surprise again is the GBP/USD rate which has now dropped below cloud support on the weekly chart. By taking out the $1.57 level in Friday’s trading, and this level has not been revisited in Asian or European trading, the UK currency now looks vulnerable to considerable weakness with targets in the low $1.50’s at least.
Should sterling rally today, then a good entry point on the short side would be $1.5720.
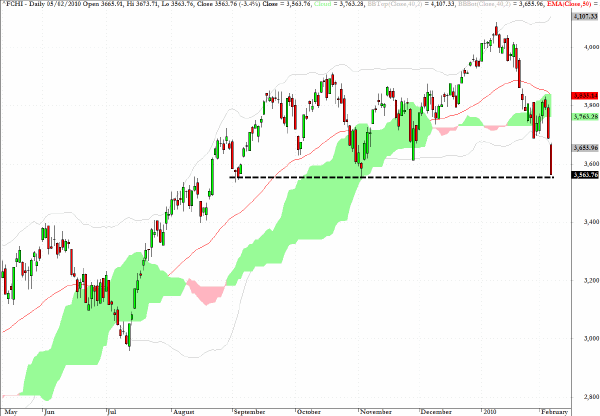
One index which I rarely comment on, the CAC 40 in France, looks more precariously balanced at a key support level than its counterpart in London and Frankfurt.
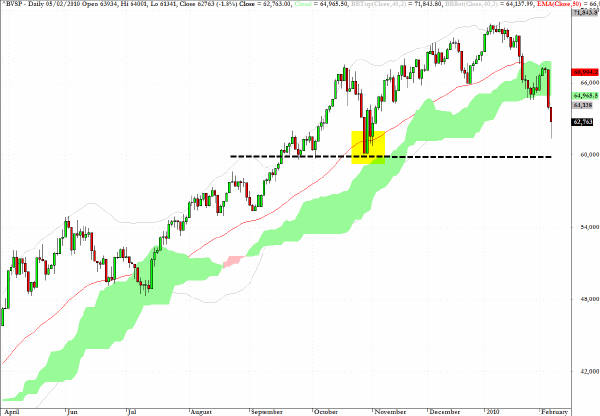
The Bovespa index in Brazil just managed to register a green candlestick at the end of Friday’s session and has a very pronounced long lower shadow which suggests that there was buying support which kicked in associated with the late recovery in US equities.
Once again one should be on the lookout for a bear flag pattern to evolve with an eventual target in the relatively near term of 60,000.
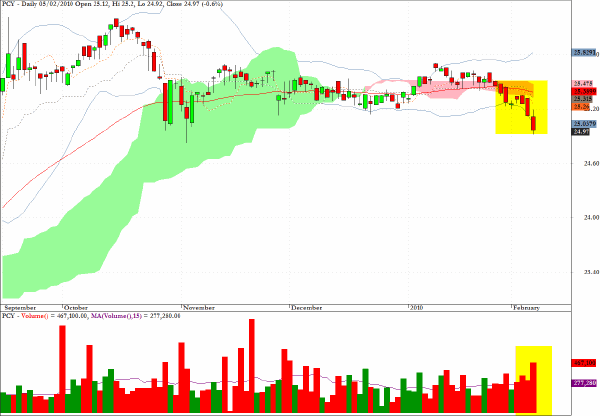
One other sector fund which would be worth monitoring is PCY which is a play on the sovereign debt of emerging markets. The fund has seen some large volume days associated with a break below key support levels and with the ongoing concern about the Club Med problems in Europe there are enough good reasons to suspect that those exposed to emerging market debt and other "exotic" securities may feel that it is time to take some more money off the table.
Clive Corcoran is the publisher of TradeWithForm.com, which provides daily analysis and commentary on the US stock market.
|