| Corcoran Technical Trading Patterns For February 9 |
| By Clive Corcoran |
Published
02/9/2010
|
Stocks
|
Unrated
|
|
|
|
Corcoran Technical Trading Patterns For February 9
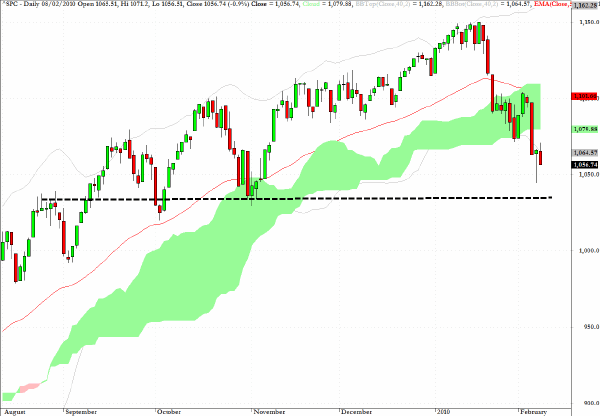
US equities struggled again yesterday with the DJIA closing below 10,000 - and in so doing attracting such comments in the mainstream press as "Dow Jones crashes below 10,000" (hardly!) and the S&P 500 continuing down to the 1056 level.
Reviewing the chart for the broader market index, it would appear that the S&P 500 is headed for a test of the 1035-1040 zone where, as illustrated on the chart, there is a region of visible chart support.
Concerns about the sovereign debt market are still very much weighing down any more buoyant sentiment arising from better earnings reports than had been expected.
There is anecdotal evidence that many institutions are becoming too pessimistic, with lots of defensive buying of puts and rotation out of risk-sensitive sectors, which suggests that we should expect a rather sharp short covering rally.
This might be triggered by any news from the European Union policy makers that is seen as supportive of the euro and Greek, Portuguese and Spanish debt. Evidence suggests that many hedge funds are massively short the euro, and it may be that FX traders will stir the already confusing brew of cross currents to instigate a short term anxiety attack for those funds that are focused on correlation strategies.
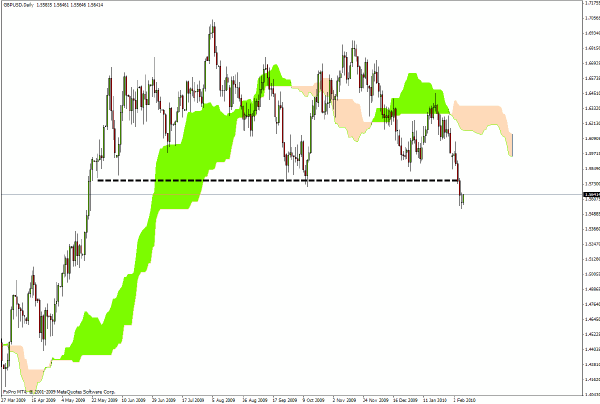
Retail sales data in the UK for January was abysmal and there are more commentators drawing attention to the parallels between the plight of the UK’s public balance sheet and those of the PIIGS nations. The big difference of course is that the UK can print more of its own currency until the cows come home.
While this may be able to alleviate the ultimate anxiety about a default by the UK government the fact that the UK will increasingly have to sell its gilts to foreigners will continue to pressure sterling.
As indicated on the chart the area above the current spot price as this is being written will present a significant hurdle, especially if the euro remains under pressure.
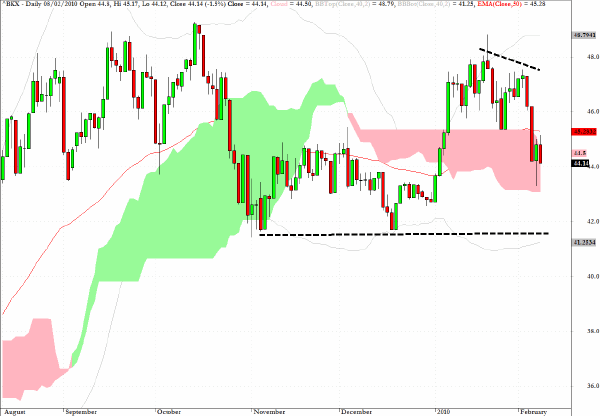
The banks and the financial sector were one of the weaker sectors yesterday with XLF (featured here last week) dropping by two percent yesterday. The intraday low remained within the range carved out in Friday’s session and the volume diminished on yesterday’s decline.
Reviewing the KBW Banking Index (BKX) I would suggest that a possible development would be a congestion pattern within the cloud formation followed by a retest of the $42 level. At that level the risk/reward calculus would then be supportive of an intermediate-term long position in this sector.
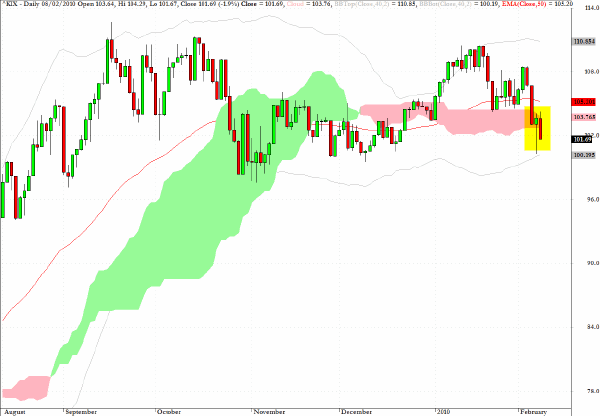
The insurance sector (KIX) closed below the Ichimoku cloud formation yesterday. There is evidence of support not far below yesterday’s close, but the notable failure of this sector to reach back - during January to the levels seen in September/October of last year is not an encouraging sign - on a longer-term basis - for this sector.
The charts for Prudential (PRU), Aetna (AET) and Metropolitan (MET) are all revealing evidence of impending technical weakness.
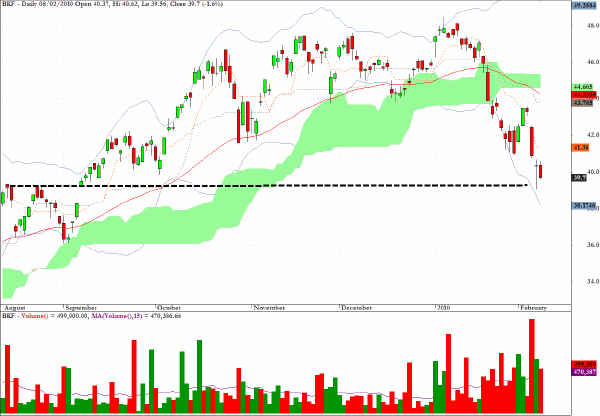
BKF, one of the sector funds which track the BRIC nations, could be preparing for a short-term bounce. Yesterday’s inside session - seen on many charts - and the proximity of chart support, lends further credence to the notion that from a short term risk/reward perspective the short side would appear to be overdone.
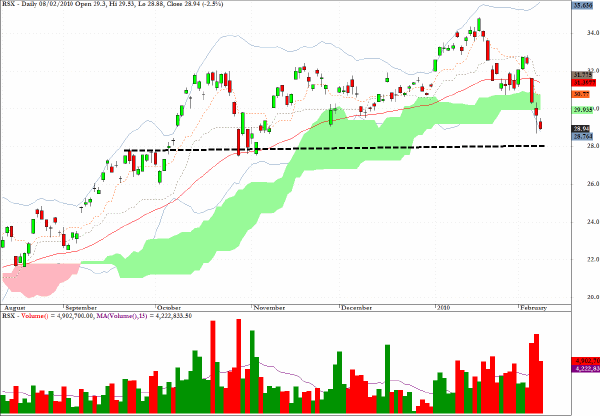
RSX, an ETF which provides exposure to the Russian market, was referenced in this column on January 18 at which time I anticipated a 10-15% correction. At this point this has almost been satisfied and once again this would be a good time to retire any short positions.
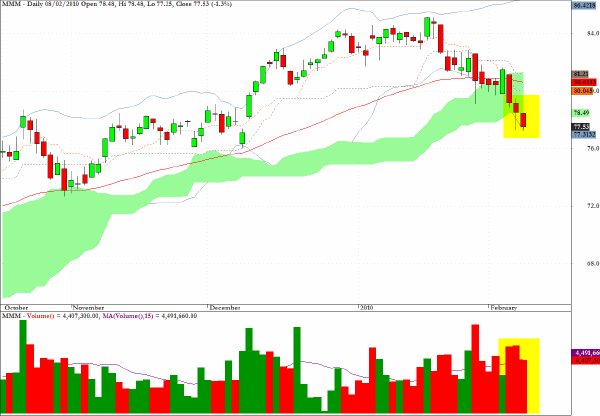
When companies such as 3M (MMM) have fallen below key support levels (i.e. the 50-day EMA and cloud support) and volume patterns are indicative of distribution it is advisable to be cautious about the blue chip sector.
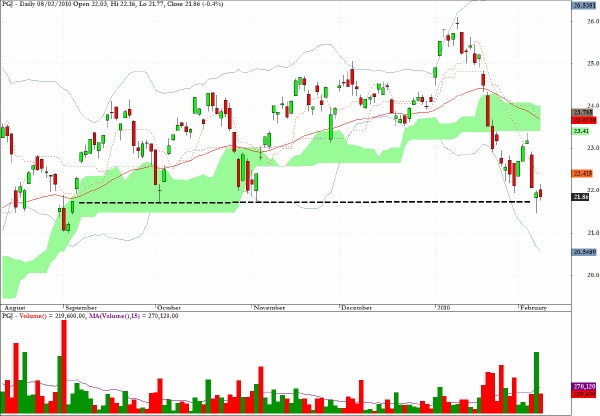
Another candidate for a short-term bounce is PGJ which is an exchange traded fund with the evocative title - the Power Shares Golden Dragon Halter USX China.
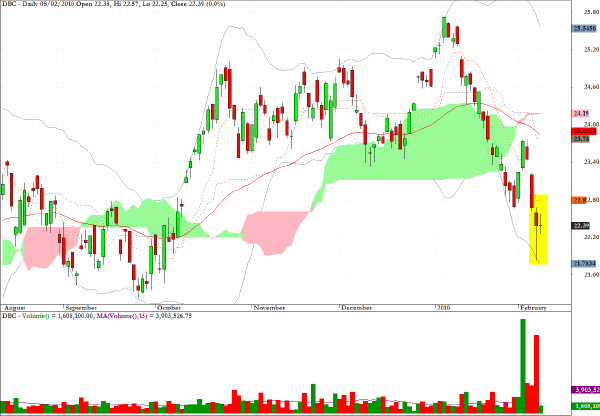
The final bounce candidate for today’s session is DBC an ETF which tracks the general commodity sector.
In particular the inside doji pattern on miniscule volume is supportive of a short-term and counter-trend reversal.
Clive Corcoran is the publisher of TradeWithForm.com, which provides daily analysis and commentary on the US stock market.
|