| Corcoran Technical Trading Patterns For February 10 |
| By Clive Corcoran |
Published
02/10/2010
|
Stocks
|
Unrated
|
|
|
|
Corcoran Technical Trading Patterns For February 10
Further to my discussion yesterday regarding the likelihood that markets would sense some relief as the EU "appears" to be moving towards some form of rescue package for the Greek government there was a bounce in the expected asset classes - emerging markets, commodity related sectors and some weakness in the US dollar. The euro made some headway yesterday, and may, at least, have pulled out of its nosedive, but to say that the currency surged as some reports suggested, seems like an overstatement.
There are varying opinions on just how much good news there will be for those concerned about the sovereign debt of the peripheral EU nations coming out of the EU summit meeting to be held on Thursday and markets could behave somewhat erratically as the week progresses.
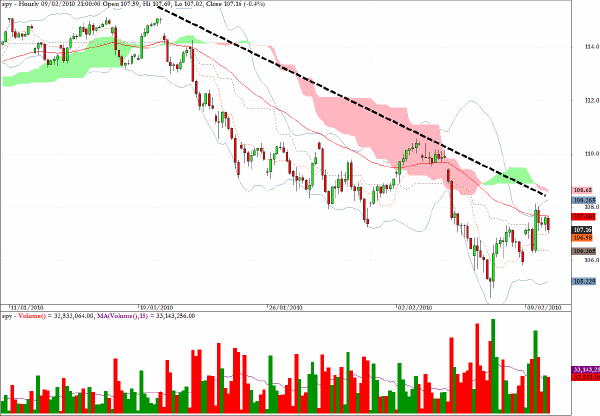
The hourly chart for the S&P 500 proxy illustrates the difficulty that US equities now face which is one of trying to penetrate above the descending 50-period EMA (the red line on the chart) and the overhead resistance of the cloud formation. We may well see another attempt to break through this resistance today but I would be wary on the long side and would keep one eye firmly on the EUR/USD cross rate.
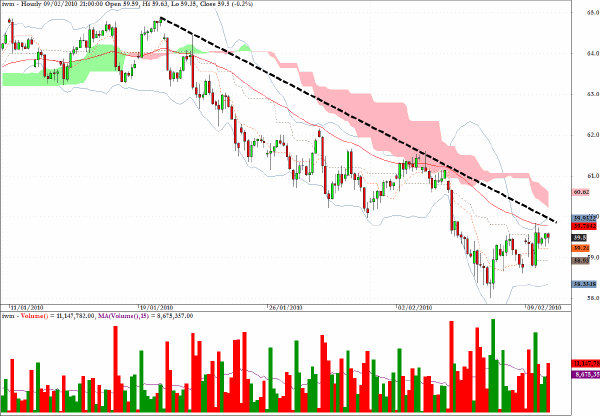
Very similar reasoning applies to the Russell 2000 proxy, IWM, in the near term. In the longer term, putting aside the concerns about the Eurozone etc. the real test for the bullish case regarding the patchy evidence that the US is in a slow recovery mode will be to monitor the ratio of gains in the small cap universe of stocks versus the large cap stocks, especially the Nasdaq 100. If there is a cyclical upturn ahead, then the Russell 2000 needs to be in the vanguard of any equity rallies going forward.
I remain sceptical that this is a normal cyclical recovery story, and believe that the underlying financial economy is still in a fragile state.
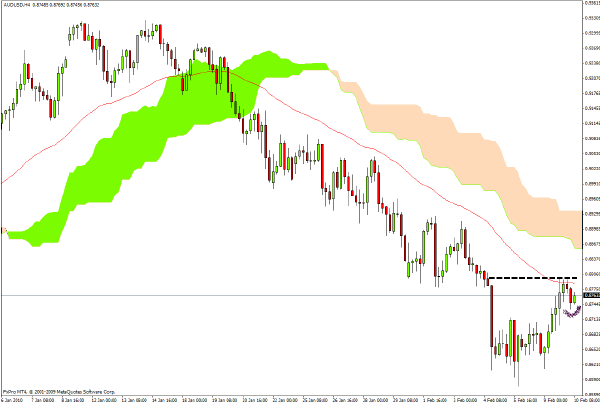
The 240-minute chart for the Australian Dollar/US Dollar pair also reveals that the Aussie currency has remained below overhead resistance from the 50-period EMA and Ichimoku clouds extending back into mid January.
There is, however, an intriguing pattern emerging on the right hand side of the chart which could (and I would emphasize that this is just an hypothesis) evolve into a potential breakaway to the upside indicating renewed strength for the Australian dollar. This will be one of the charts that I shall be closely monitoring today.
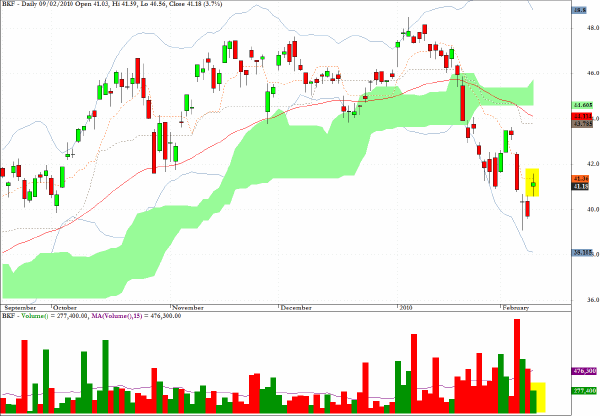
All of the suggestions that I made in yesterday’s column regarding bounce potential moved up including the RSX sector fund, which tracks major Russian equities, and in particular the fund for the BRIC sector, BKF, moved up by 3.7%. However, the volume on the move was anemic and the spinning top candlestick suggests that sentiment towards the emerging markets is far from exhibiting the kind of enthusiasm that was seen during the latter half of 2009.
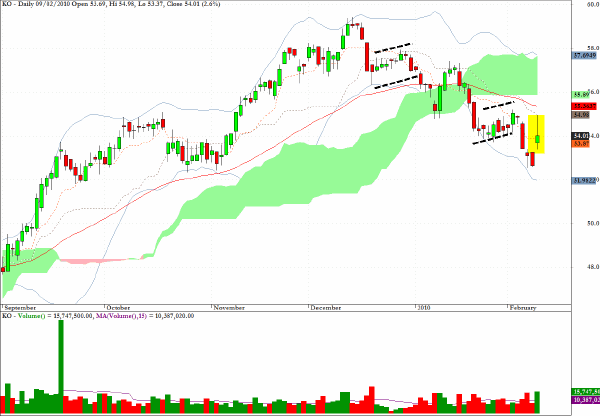
Earlier this week I suggested that the chart pattern for 3M - a Dow component was not very reassuring for the bullish argument. The daily chart for Coca Cola (KO) below is also revealing signs of a downward staircase formation with distribution characteristics.
The earnings show that US sales growth is weak and that most growth is coming from Asia. In this respect it echoes a similar earnings report from yet another DJIA component, McDonalds. All of these reports, from such ubiquitous multi-national companies, provide probably greater insight into the state of the real global economy than many of the statistics released by the various government agencies around the world.
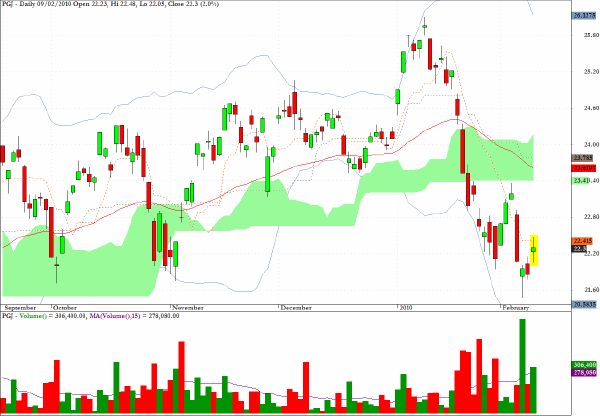
Of the bounce candidates mentioned yesterday, PGJ, the fund with exposure to China moved up 2% but also finished with a spinning top candlestick, indicating that the move lacked real conviction.
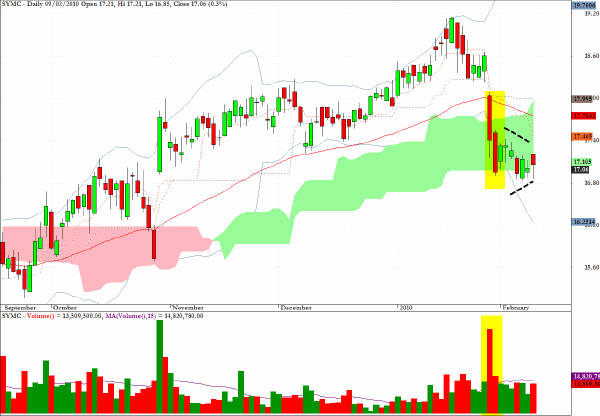
Symantec (SYMC) has a bearish looking flag/pennant formation with the appropriate volume characteristics, and the stock could be headed towards $15.
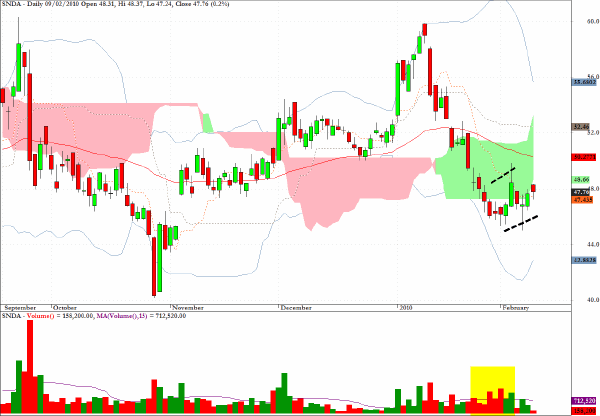
Shanda Interactive (SNDA) also has a technically weak pattern and may be set to revisit the lows from last October in the intermediate term. The normal qualifications apply regarding the fact that this outlook may not unfold in the next couple of sessions.
Clive Corcoran is the publisher of TradeWithForm.com, which provides daily analysis and commentary on the US stock market.
|