| Corcoran Technical Trading Patterns For February 11 |
| By Clive Corcoran |
Published
02/11/2010
|
Stocks
|
Unrated
|
|
|
|
Corcoran Technical Trading Patterns For February 11
Much attention today will be focused on the meeting taking place in Brussels of heads of state of the EU countries regarding the "Greek situation". The EU is between a rock and a hard place, and apart from the obvious discomfort being felt by German politicians especially about how to sell a rescue package to the German voters, there are additional strands in the debate that will pose more awkwardness. For example, will Gordon Brown acting on behalf of the UK, which is a member of the EU but not of the Eurozone, be asked to contribute to loan guarantees, for example, for distressed states who do share the euro currency? If so, how easy will it be for him to sidestep that?
Also there is a danger that with all of the attention being centered on the plight of the euro two other noteworthy developments are creating ripples which could quickly turn into turbulence for the credit markets. The first relates to Bernanke’s written remarks which surfaced yesterday which amount to the first articulation of the Fed’s exit strategy. The second relates to the fact, as reported by Ambrose Evans-Pritchard, that Chinese authorities are instructing their asset purchasers to be more diligent in avoiding the riskier sovereign and corporate debt instruments. Both of these developments are starting to have an effect on the bond and fixed income markets as suggested in some of the charts discussed below.
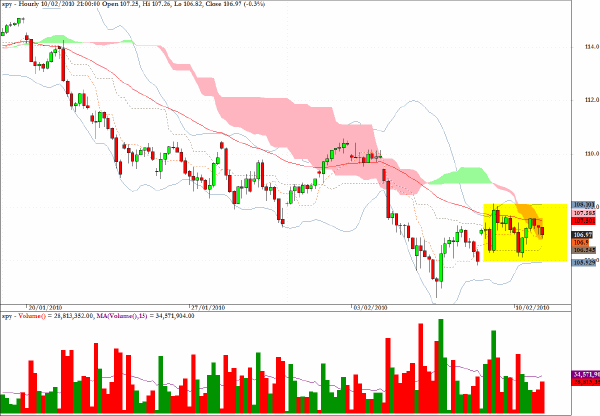
SPY, in line with the commentary here yesterday, once again failed to penetrate either the 50-hour EMA or cloud formation in intraday trading yesterday. Also the volatility bands are constricting which suggests that a breakaway is imminent. One scenario (among others) is that a knee-jerk rally on any perceived good news from the EU could lead to a spike upwards which could then be seen as an excellent shorting opportunity by those traders that are more focused on the changing interest rate/risk aversion environment.
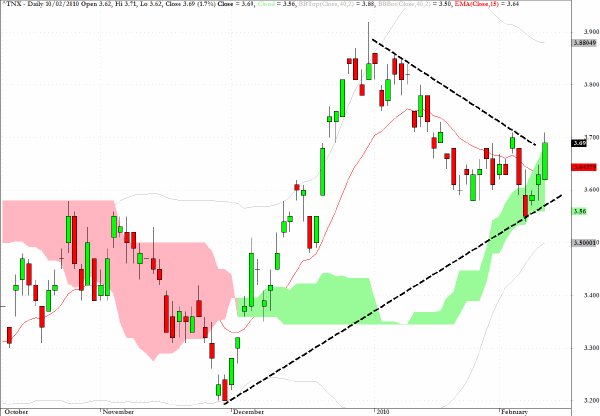
The yield on the US Treasury note of ten-year duration along with shorter-term maturities is moving forward and as the chart suggests it would be good to monitor followthrough from the piercing of the triangular formation as well as a break above the clouds.
One factor to contemplate is that seeking out assets in the US Treasury complex may still be the preferred safe harbor of choice, but if all debt instruments are becoming subject to a higher risk premium, along with the Fed’s intention to begin removing liquidity, even those fleeing to quality may need a higher return to keep funds in these instruments over the longer term.
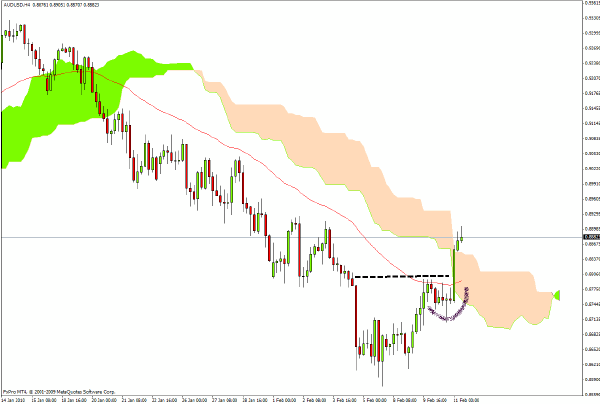
Further to yesterday’s comments regarding the AUD/USD cross rate, the Australian dollar did break away from the pattern which I touched on and the way is clear for further progress. However, on the daily chart there is a clear level of resistance at the 0.90 level.
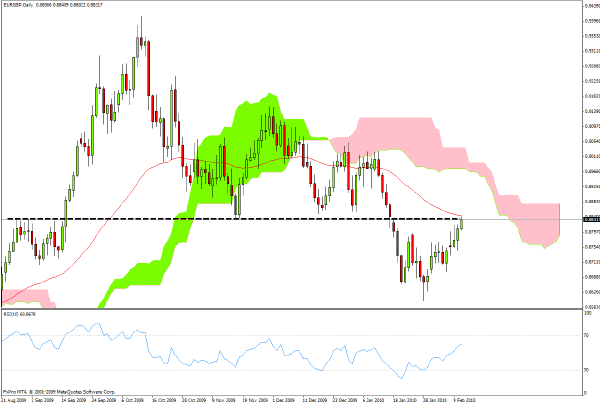
Most attention will be focused on the exchange rate between the euro and the US currency but also interesting is the cross rate EUR/GBP. Sterling has been exhibiting weakness, fueled again yesterday by comments from Mervyn King at the Bank of England, which were too realistic and not spun politically enough for some investors, and the euro has rallied against sterling. However, as the chart suggests, the easy money on exploiting this cross rate may have been made already.
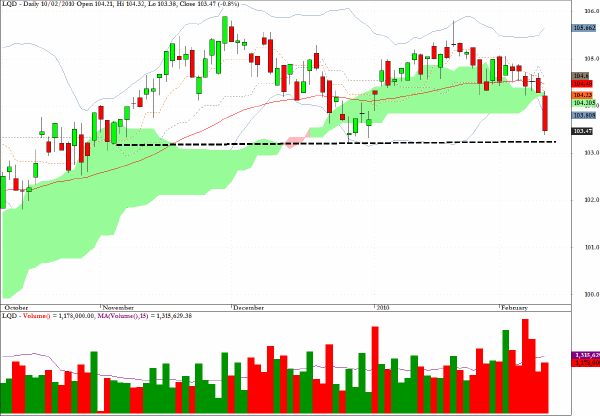
Investment grade corporate bonds were showing considerable weakness yesterday as the chart for the sector fund LQD reveals. Price has notably dropped below the cloud but may find support at the level indicated but clearly the volume chart is pointing to a gathering exodus from this sector.
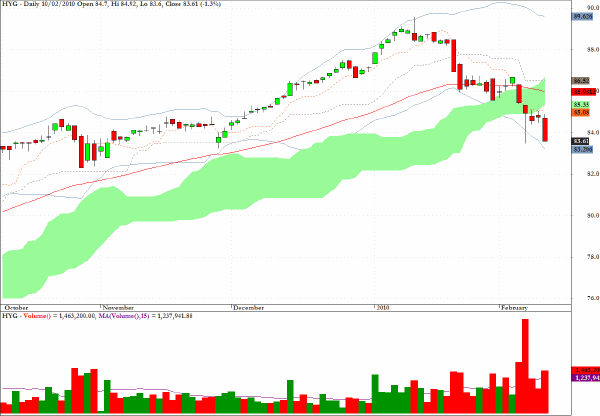
Investors also are exiting high yield debt - as represented by the HYG sector fund - which was one of the best performing asset classes in the latter half of 2009.
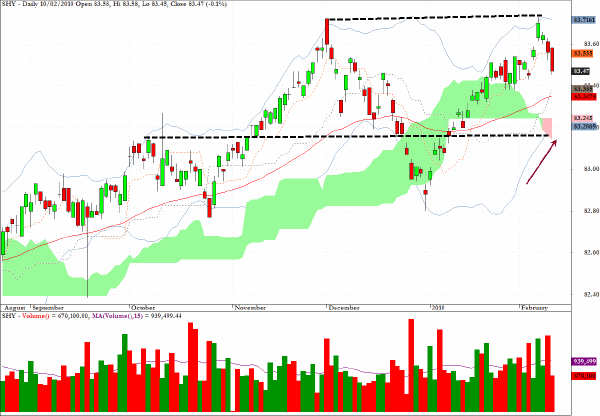
The final chart which I shall be keeping an eye on in the near term is for the short end of the Treasury complex. SHY is an exchange traded fund which tracks US government securities of up to three-year maturity and a double top appears to be in place with price projections below to the level indicated on the chart.
Clive Corcoran is the publisher of TradeWithForm.com, which provides daily analysis and commentary on the US stock market.
|