| The McMillan Options Strategist Weekly |
| By Lawrence G. McMillan |
Published
02/11/2010
|
Options
|
Unrated
|
|
|
|
The McMillan Options Strategist Weekly
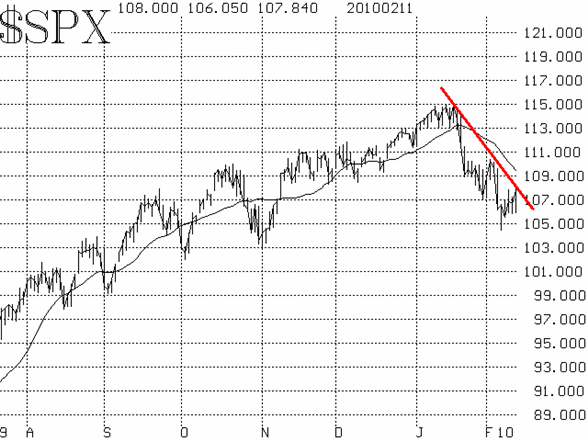
The chart of $SPX now clearly shows lower highs and lower lows. That is an intermediate-term bearish pattern.
An oversold rally has sprung up this week, and it could carry to resistance at 1085-1100, an area also bolstered by the presence of the now-declining 20-day moving average.

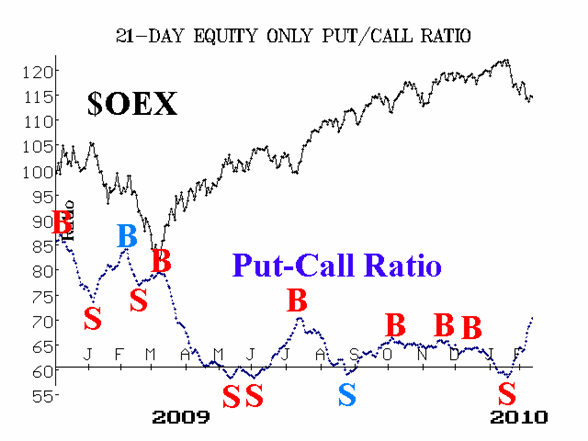
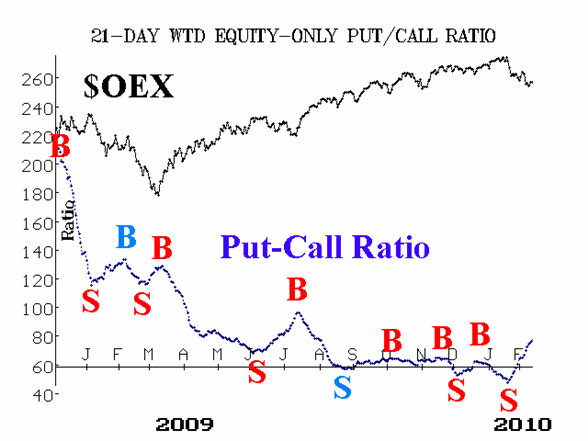
Equity-only put-call ratios are on intermediate-term sell signals as well (see Figures 2&3). Those signals will remain in place until the ratios roll over and start to trend downward.

Market breadth became deeply oversold. It is primarily this oversold condition that spurred the rally this week.

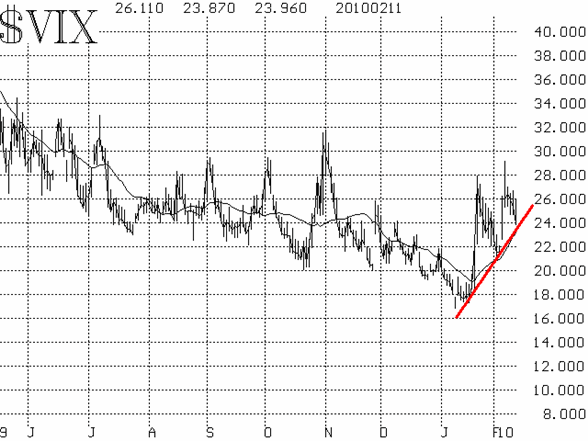
Volatility indices ($VIX and $VXO) served up a change of pace from their recent bull market patterns, by not making new lows after having spiked up in late January. As a result, $VIX is now in an uptrend, and that's bearish for stocks.

In summary, there are intermediate-term sell signals from the $SPX chart, the $VIX chart, and the equity-only put-call ratios. The reflex oversold rally that has taken place this week is a bit "stickier" than usual, but it should have trouble with overhead resistance just above current levels.
Lawrence G. McMillan is the author of two best selling books on options, including Options as a Strategic Investment, recognized as essential resources for any serious option trader's library.
|