| Corcoran Technical Trading Patterns For February 16 |
| By Clive Corcoran |
Published
02/15/2010
|
Stocks
|
Unrated
|
|
|
|
Corcoran Technical Trading Patterns For February 16
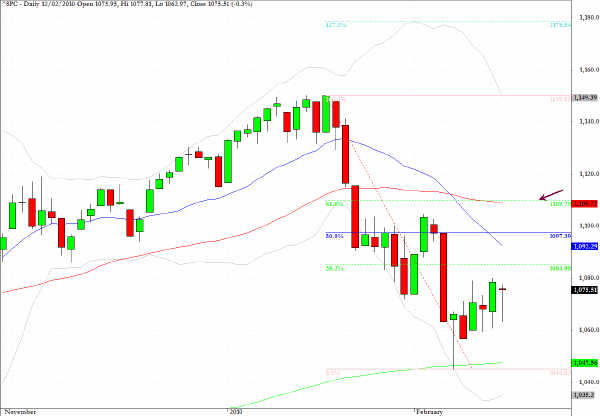
After the long weekend in the US and with much of Asia celebrating the Chinese New Year - incidentally this is the year of the ox - the S&P 500 may drift upwards towards the hurdles illustrated below using the fibonacci retracement grid. The key levels to watch are 1085 (i.e. 38% retracement of the recent swing high and low), 1098 which is at the 50% level and 1110 at the 62% level.
In the context of the bearish pullback/flag pattern it would be quite an accomplishment for this index to make it back to 1110 and, should it do so, it would provide a very promising opportunity to establish new short positions. For the time being, the risk/reward ratio favors short-term scalping moves with a bias towards selling rallies based on where the intraday patterns run into resistance.
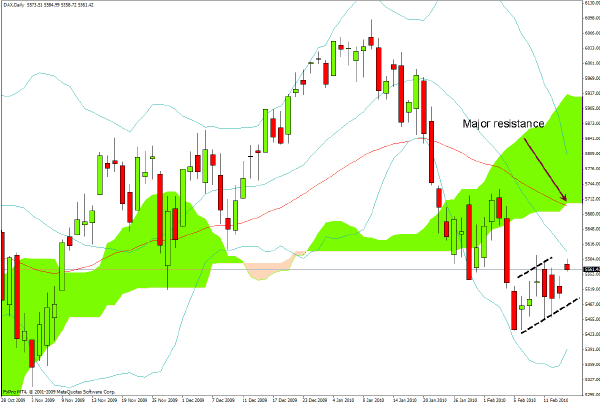
Germany’s DAX is also exhibiting the characteristics of an evolving bearish flag formation on the daily charts. One of the remarkable features for those trading this index recently has been just how successful it has been to fade opening gaps to the upside. Over the last week there has been almost a daily pattern for the bulls to get energized at the start of trading each session, lift the index quickly on a gap, and then to be faded for the rest of the day.
Illustrated on the chart below is a level of major intermediate-term resistance at 5750 which sees the intersection of the 50-day EMA and the Ichimoku cloud formation, although I suspect that weakness should be encountered sooner in the near term.
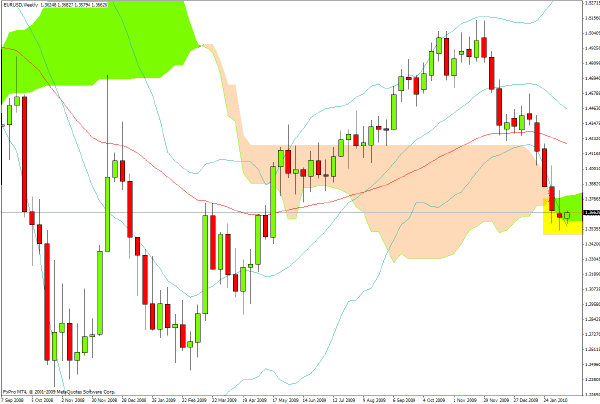
EUR/USD has been treading water recently as the ramifications of the Greek debt crisis rumble on.
On the weekly chart one can see that the current level is a key area where some support from the base of the cloud as well as the weekly lower Bollinger band are situated. However, it can also be seen that the green cloud is not very wide and that $1.38 level should be a major hurdle on any rebound.
Some of the more interesting revelations of the last few days have arisen in connection with the arcane financings arranged by Goldman Sachs and JP Morgan for the Greek government (as well as some other European sovereigns with similar public finance "issues").
Not only does it appear that some of these governments have been securitizing future cash flows from the use of public services and realizing gains immediately to make their balance sheets look prettier, but in their own inimitable way, if reports are to be believed, the financial engineering exercises performed by the Wall Street firms also provided them with sufficient insight into the dire straits of some governments, that they saw an empty goal for taking aim at the sovereign bonds by using the CDS markets. Just maybe the European financial regulators will decide to dig more deeply into such shenanigans and GS may find itself persona non grata in government offices in European capitals.
The UK’s maverick columnist, Ambrose Evans-Pritchard has the following interesting comments on the plight of the Greek government and the ripples emanating from it.
Eurosceptics should resist any Schadenfreude over the unfolding EMU drama in Greece. (Not to mention the huge exposure of British banks to Club Med). The Greek crisis is a dress rehearsal for attacks on any sovereign state with public accounts in disarray.
While Britain went in to this crisis with a much lower public debt than Greece or Italy (though higher total debt than either), it now has the highest budget deficit in the OECD rich club — and perhaps the world — at 13pc of GDP.
I have a very nasty feeling that markets are about to pounce on Britain.
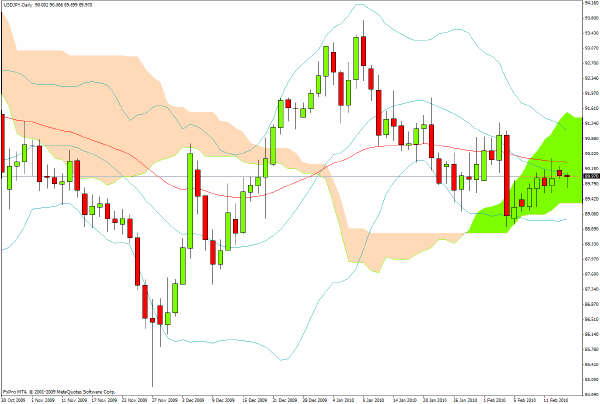
The daily chart for USD/JPY shows that recent price activity resembles a well defined bearish flag pattern within the green cloud pattern. There is clear overhead resistance from the 50-period EMA and I shall be monitoring this cross rate in coming sessions for signs that the flag pattern has completed.
Without wanting to sound as though I would like to have my cake and eat it too, however, the longer term patterns on the yen are beginning to suggest that when the USD/JPY moves out of an extended downward wedge pattern (based on US dollar weakness) there could be a sharp drop ahead for the yen. But in the near term the odds favor the yen bulls.
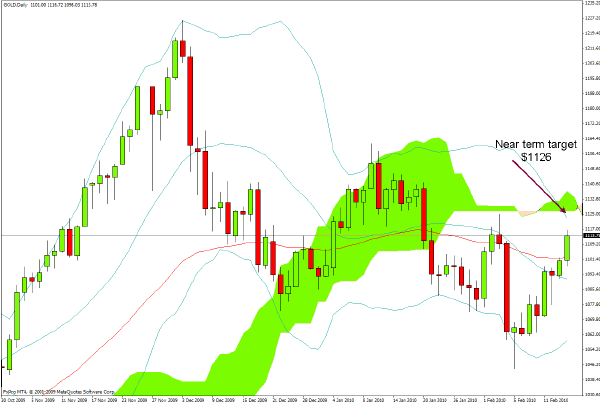
Spot gold faces near term resistance in US dollar terms at the $1125-30 level, but priced in euros it’s a breakaway pattern.
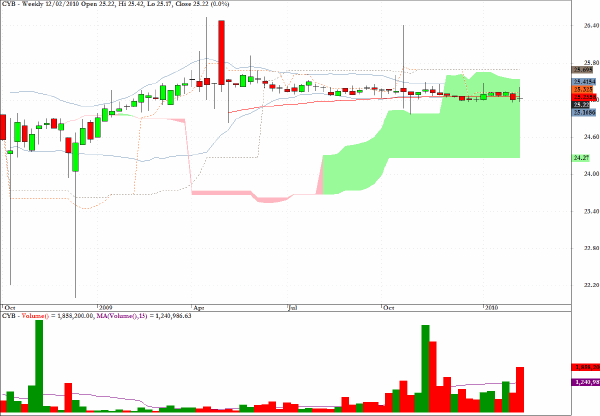
If the current chatter about a possible revaluation of the Chinese renminbi against the dollar has any substance - and even such luminaries as Jim O’Neill at Goldman appear to be ruminating on the possibility - the place to be is long the exchange traded fund CYB.
The weekly chart below shows that, as would be expected from a pegged currency, this has not been a trading vehicle for those looking for exciting action, however by buying a speculative stake in the fund and putting it to one side, if the Chinese do revalue this could deliver a nice reward.
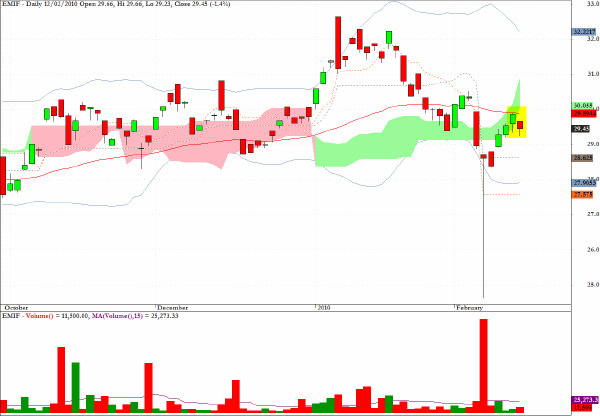
EMIF, which is a play on the development of infrastructure projects in emerging markets, looks vulnerable after the recent pullback from the recent sharp drop.
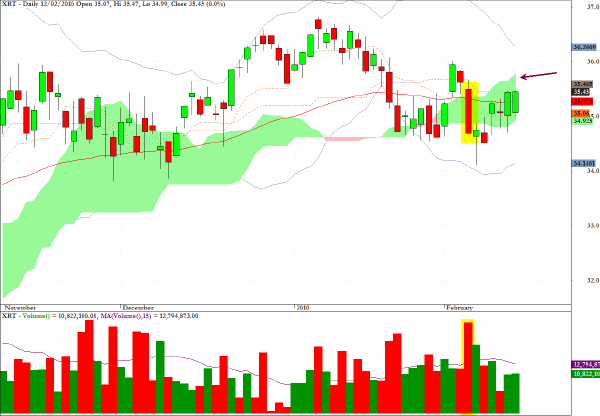
There would appear, at least in the near term, to be limited upside potential for XRT, an exchange traded fund which tracks retailing as it too exhibits a pullback from recent selling which appears to be close to completion.
Clive Corcoran is the publisher of TradeWithForm.com, which provides daily analysis and commentary on the US stock market.
|