| Corcoran Technical Trading Patterns For February 17 |
| By Clive Corcoran |
Published
02/17/2010
|
Stocks
|
Unrated
|
|
|
|
Corcoran Technical Trading Patterns For February 17
Thanks to the many readers who pointed out my error from yesterday’s commentary in calling the Chinese New Year which began on Sunday - the year of the ox. The year of the ox was, in fact, terminating and we have in fact just entered the year of the tiger! I am even assured by some who contacted me that this could also be a year of good fortune.
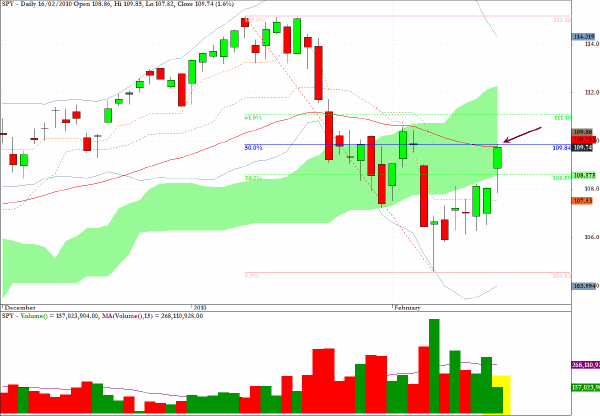
Following on from yesterday’s discussion on the S&P 500, the index made a nice move upwards and came to rest almost exactly at the 50% fibonacci target outlined yesterday. The equivalent fibonacci targets have been superimposed on SPY, the tracking fund for the index, with the 62% level now set up as a feasible target during the remainder of this week.
The volume was very subdued and a lot more conviction will be required from the bullish side to take out further overhead resistance that lies above the cash index as it moves above the 1100 level towards a challenge of the 62% retracement at 1110.
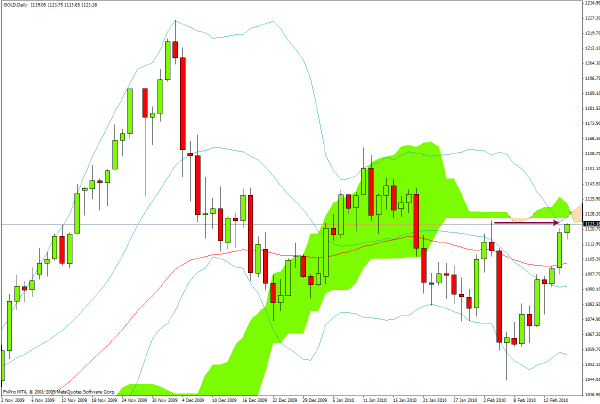
Spot gold also performed as anticipated and, as of early European trading on Wednesday, has moved up to $1123.30 which is almost exactly the $1125 level targeted here yesterday. This would be a good point to exit the long side while the metal digests recent gains.
As with many markets yesterday, the sagging dollar brought back echoes of the reflation trade which was so much in evidence in the second half of 2009 and the intermediate outlook for the precious metal will be influenced by the degree to which the US dollar retraces its recent advance.
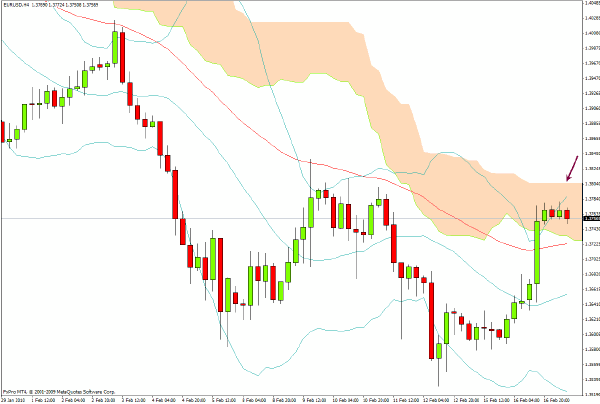
The large number of trading desks which have been building short positions in the euro during most of 2010 were anxious to cover as the currency, which found support at the $1.35 level, as indicated on the weekly and daily Ichimoku charts, made a sharp recovery yesterday.
I shall repeat my suggestion that making further progress and breaching the $1.38 level will be a much more daunting challenge.
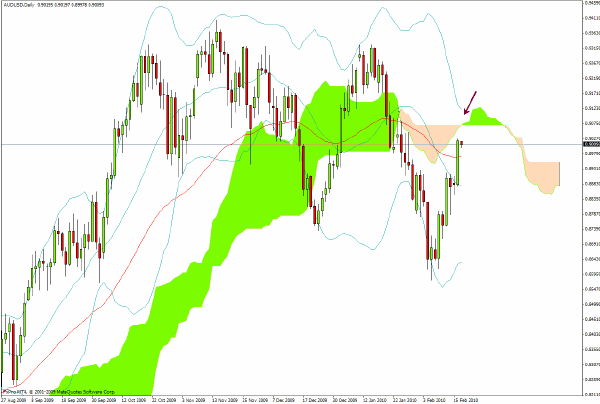
Also in the FX arena, AUD/USD has mounted a nice rebound as anticipated here last week but the pair is approaching a level where the reward/risk ratio is no longer favorable, in my estimation.
This may not be exactly the right time to initiate new short positions but I shall be on the lookout for entry opportunities once there is evidence that US dollar correction is nearing completion.
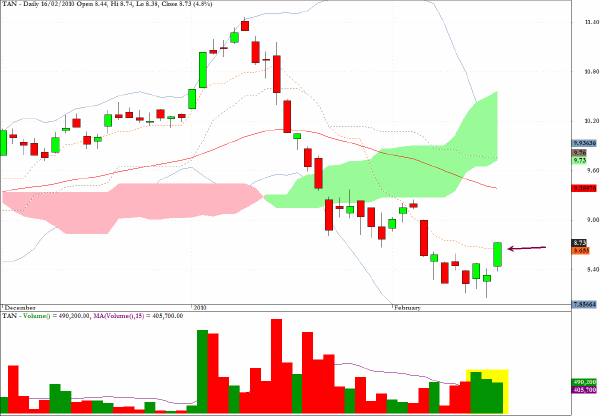
The chart pattern for TAN, a sector fund which tracks solar energy stocks, looks constructive on the long side with evidence that the recent sell-off is attracting buyers. A target in the region of $9.50 would seem feasible in coming sessions.
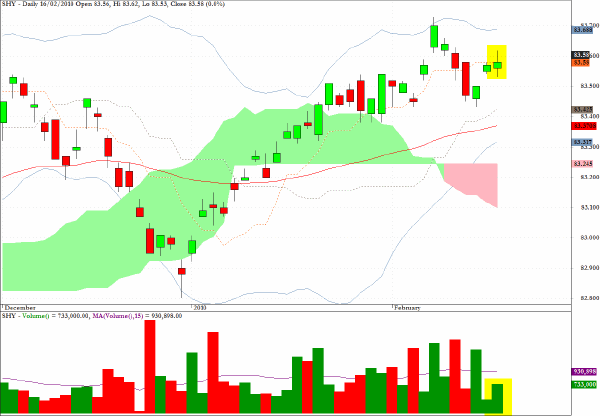
SHY, an exchange traded fund which tracks US government securities of up to three-year maturity, has a chart pattern which shows what appears to be a double top followed by a limited correction and with the recent move back towards the recent highs appearing to be fading. This interpretation is reinforced by yesterday’s spinning top candlestick and volume patterns.
In addition, the following news story from AP suggests that the appetite for short-term US government securities from foreigners, specifically the Chinese, is diminishing.
WASHINGTON (AP) -- A record drop in foreign holdings of U.S. Treasury bills in December sent a reminder that the government might have to pay higher interest rates on its debt to continue to attract investors.
China reduced its stake and lost the position it’s held for more than a year as the largest foreign holder of Treasury debt. Japan retook the top spot as it boosted its Treasury holdings.
The Treasury Department said foreign holdings of U.S. Treasury bills fell by a record $53 billion in December. That topped the previous record drop of $44.5 billion in April 2009.
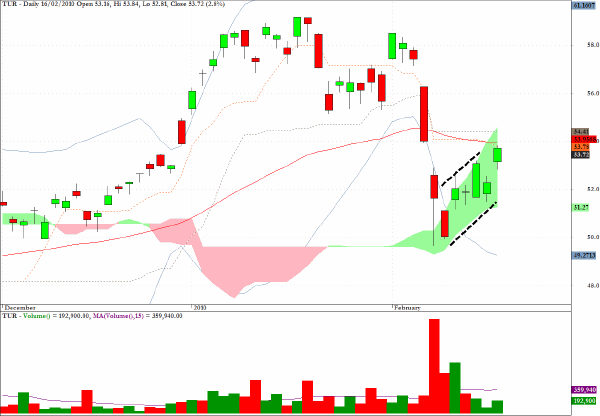
TUR, a sector fund which tracks Turkish equities, has a remarkably well formed bear flag pattern, but as is always the case with this pattern, patience is a virtue and the desired directional breakdown may not be immediate.
If one is drawn to the short side in today’s session a stop loss level of $54.80 would be advised.
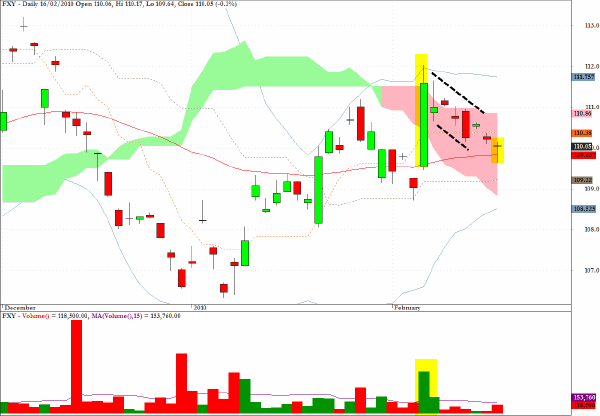
Switching from a well-defined bear flag to an equally well-defined bull flag, the exchange traded fund FXY tracks the movement of the Japanese yen against the US dollar.
Unlike the spot forex charts for USD/JPY which are featured in this column, this chart needs to be interpreted as one where strength in the yen will result in a move upwards in the fund. The doji star which is sitting on the 50-period EMA and the position within the Ichimoku cloud would suggest that this is another trade with clear upside potential, and, I suspect, limited loss potential if the stop is placed near the intraday low of the large green candlestick highlighted on the chart (the low on this candlestick from February 4 was actually 109.46).
Clive Corcoran is the publisher of TradeWithForm.com, which provides daily analysis and commentary on the US stock market.
|