| Corcoran Technical Trading Patterns For February 18 |
| By Clive Corcoran |
Published
02/17/2010
|
Stocks
|
Unrated
|
|
|
|
Corcoran Technical Trading Patterns For February 18
Apologies are due for a second day in a row as there was a glitch in the mailing program for the Daily Form commentary yesterday which resulted in some readers getting multiple copies of the column and some readers getting nothing. For those who missed the column yesterday, I also had to correct Tuesday’s howler that this was the Chinese year of the ox - it is of course the year of the tiger.
This afternoon I shall be doing a TA slot on CNBC’s European Closing Bell and want to spend a little time (and that is all one gets!) talking about the benefits of using the Ichimoku cloud formations, not only for generating entry signals but also for assisting in selecting suitable stop-loss levels.
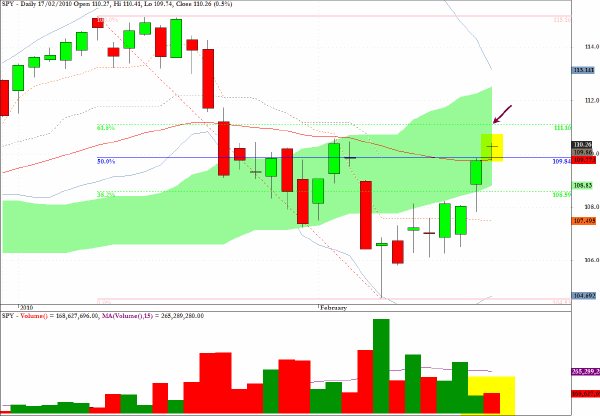
I have shown the chart for SPY already this week and I find yesterday’s doji star pattern just above the 50% retracement level to be indicative of a lack of conviction on the part of equity investors in the recent rebound from the selling that began in mid-January and which "appears" to have subsided.
Volume remains very subdued, the 62% retracement level indicated on the chart - and equivalent to 1110 on the cash index - suggests that the risk/reward calculus is not favoring the long side, but I would not be looking at the short side, except on an intraday scalping basis, until the index breaks back below green cloud formation.
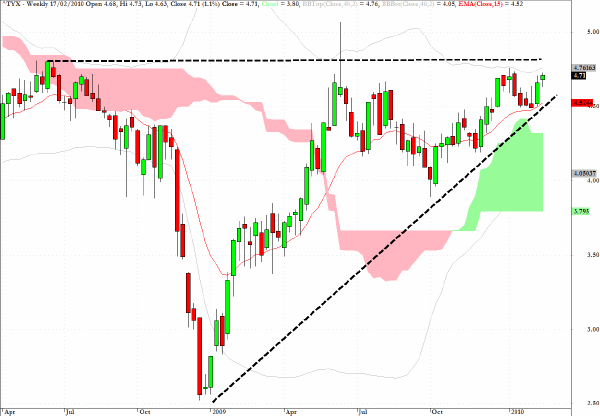
The weekly chart for the yield on the 30-year US Treasury bond strongly suggests that an ascending wedge could be preparing to blow out to the upside. News that the Chinese central banks have become net sellers of long-term US government issue as well as the added risk premium for sovereign debt in general is pointing, I would suggest, to five percent plus yields in the coming weeks.
Even if there is a reversion to the safe harbor trade when conditions in equity markets become more turbulent again, which is a scenario I still find to be probable, the risk premium required by those holding long-term bonds is, in my estimation, now on an upward trajectory.
One final comment, which was prompted by an interesting piece I came across recently (I cannot recall the source exactly) is that the global inflation threat is now not from the US/European economies - which actually have more deflationary concerns - but rather from the new economies of Asia and Latin America where the middle class is just discovering the delights of consumerism. The mature economies are in danger of importing inflation rather than, as in the past, of benefiting from the disinflationary forces of the earlier stage in the globalization process.
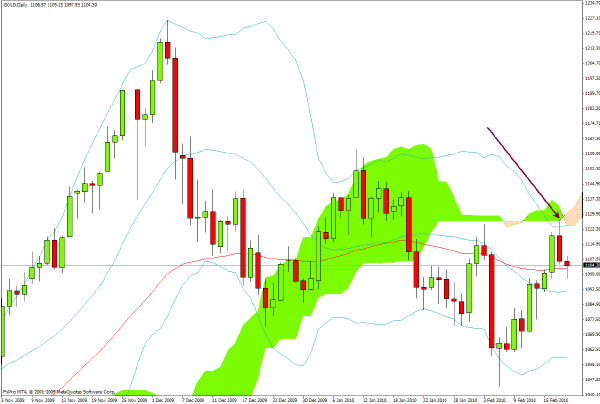
As an excellent example of the usefulness of the Ichimoku charting techniques, yesterday’s comment here that long positions in spot gold should be exited at the $1125 level proved to be uncannily accurate.
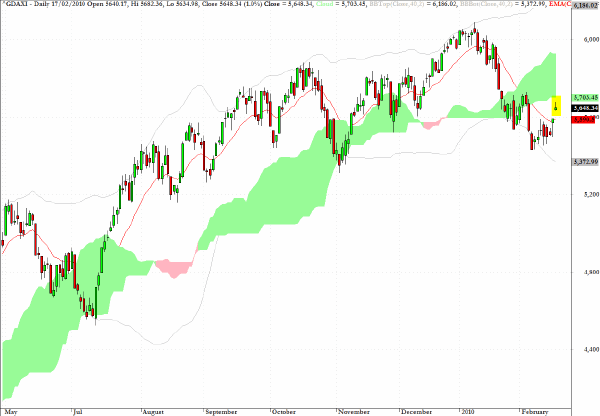
Reviewing the longer-term daily chart for the DAX, and applying the reasoning relating to cloud formations, it is worth contemplating that the drop through the green cloud broke a clear uptrend and rebound from the base of the clouds which had been in place since April 2009.
The suggestion is that the German equity index will struggle in its recent rebound to break back into the cloud.
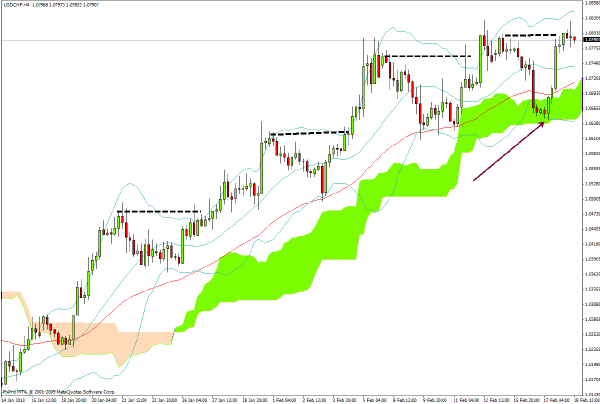
The patterns on the 240-minute chart for USD/CHF provides an excellent example of two key benefits of technical analysis.
1. There is clear evidence of the support being provided, at critical junctures, by the cloud formation.
2. A fractal pattern is evident where recent retreats can best be characterized as miniature cup and handle patterns where the subsequent breakthrough the top of the cup has lead to a development of staircase pattern.
Seen in the context of the much longer-term Elliot Wave pattern which I have discussed here recently, the outlook for the Swiss franc is one of slow attrition against the dollar. Some readers have asked how best to play this kind of view that the US dollar is a buy against the Swiss currency if they are reluctant to engage in spot forex trading. There is an exchange traded fund, FXF, which provides exposure to the Swiss Franc. If one subscribes to the thesis that this is now in a bear phase one would want to short that ETF (and perhaps not pay too close attention to the daily zigs and zags).
My comment about USD/JPY in yesterday’s commentary was not so clever as the yen weakened further. This was not in accordance with the bull flag interpretation which I provided for FXY (which is a long play on the yen) and this has now triggered my interest in the other side of the trade. A failed bull flag pattern is often (but not always!) a sign of impending technical weakness.
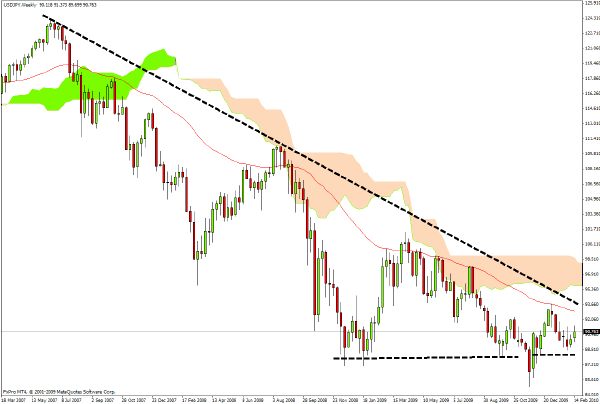
Reviewing the longer term pattern for USD/JPY, the very clear downward wedge pattern is reaching a point where there are two distinct possibilities. The first would be a break to the downside suggesting that the yen would be headed higher and into the low 80’s against the US dollar. The second would be a break out for the US currency from a persistent down trend- lasting several years - against the Japanese currency.
If the second alternative comes to pass - and once again the importance of a break above the Ichimoku cloud on the weekly chart would be a major development - then the yen could be looking at a significant retreat.
From a purely technical point of view it is difficult at this stage to anticipate the direction of the eventual breakout from the apex of this wedge pattern.
From the point of view of the risk aversion trade, a serious crack in equities would lend support to the view that the yen should benefit, but the growing risks in the Japanese bond market and the messy state of its public finances could produce the real surprise which would be a loss of confidence by external investors in the Japanese currency and capital markets. Only time will tell!
Clive Corcoran is the publisher of TradeWithForm.com, which provides daily analysis and commentary on the US stock market.
|