| Corcoran Technical Trading Patterns For February 22 |
| By Clive Corcoran |
Published
02/22/2010
|
Stocks
|
Unrated
|
|
|
|
Corcoran Technical Trading Patterns For February 22
In scanning charts this morning I am struck by how many key sectors are within cloud formations with slightly ambiguous technical characteristics. As a general rule it is advisable not to trade too actively under such conditions and I shall probably remain sidelined in today’s session until a clearer picture emerges.
Many indices and sectors have rallied back well from the weakness seen earlier in the month but volume has not been impressive and, as already suggested, the Ichimoku formations are not providing the guidance I would want to see.
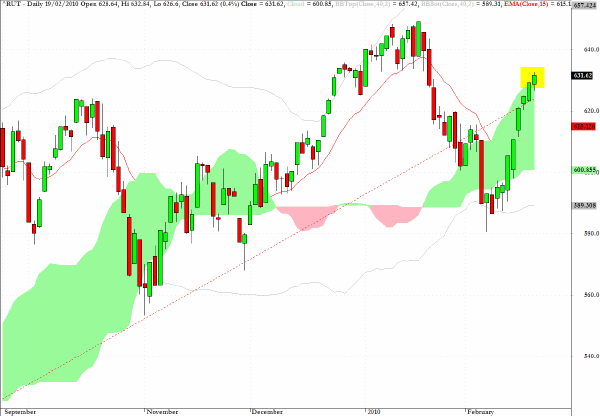
The Russell 2000 has done an impressive job of recovery since early February and has managed to regain a foothold above the dotted trendline extension which has been marked on the daily chart below.
However, the index has now peeked above the top of a cloud formation which could induce some position squaring and, not too far above Friday’s close, there is a likelihood of resistance as the index approaches the previous high from early in 2010.
As with most of the charts featured today, there is a scarcity of obvious directional signals - but that in itself is worth stating.
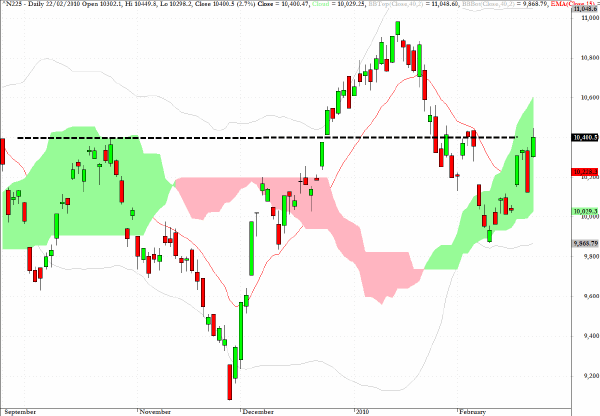
The Nikkei 225 in Tokyo managed to mount a strong reversal in trading on Monday which completely reversed Friday’s selloff and also produced a net 2.7% gain on the session.
As can be seen, there is chart resistance in the vicinity of 10,400 but the index could also be good for another 200 points to the top of the cloud pattern.
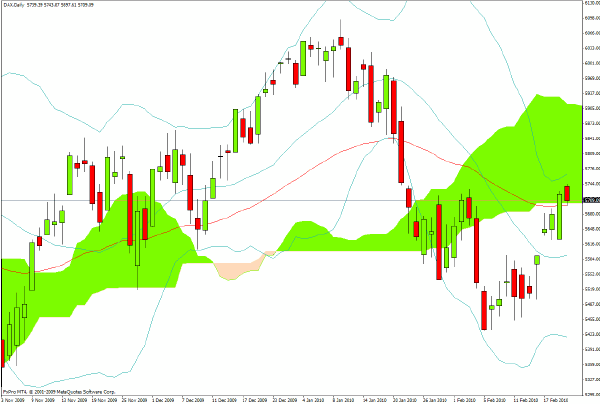
Germany’s DAX is still lingering near to resistance from the 50-day EMA, the upper Bollinger band and the green cloud formation and is definitely treading water in European trading as it awaits the opening of trading in the US in a few hours.
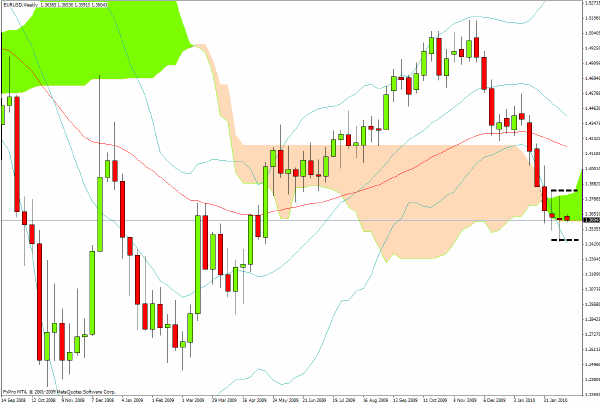
As annotated on the weekly chart for EUR/USD. the EZ currency is now constricting within a fairly tight range of around $1.38 on the upside and $1.34 on the downside.
Until the pair moves decidedly out of the green cloud I prefer to remain on the sidelines.
Longer term, the technicals are pointing to lower levels for the euro currency but that may have to wait for more anxiety about the rolling over of more than 20 billion euros of Greek debt which is scheduled in the April/May time frame.
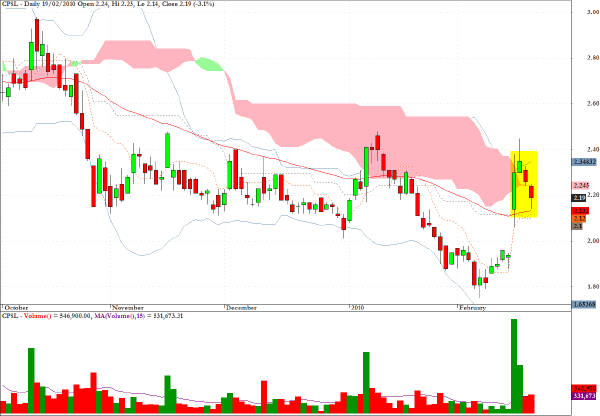
China Precision Steel (CPSL) has a fairly straightforward pattern which may well result in a strong lift off from the current level.
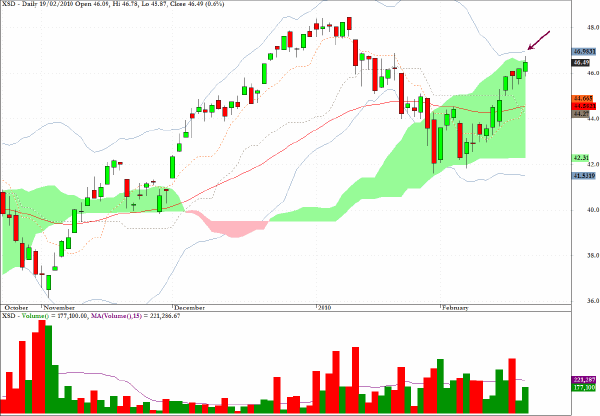
XSD, one of the sector funds which tracks the semiconductor stocks, has recovered well since early February but has now reached two potential sources of resistance - the top of the Ichimoku cloud as well as the upper volatility or Bollinger band.
However, in harmony with most comments today, I do not have sufficient conviction regarding this analysis to do anything more than look for scalping opportunities on the short side at signs of intraday resistance.
Clive Corcoran is the publisher of TradeWithForm.com, which provides daily analysis and commentary on the US stock market.
|