| Corcoran Technical Trading Patterns For February 24 |
| By Clive Corcoran |
Published
02/23/2010
|
Stocks
|
Unrated
|
|
|
|
Corcoran Technical Trading Patterns For February 24
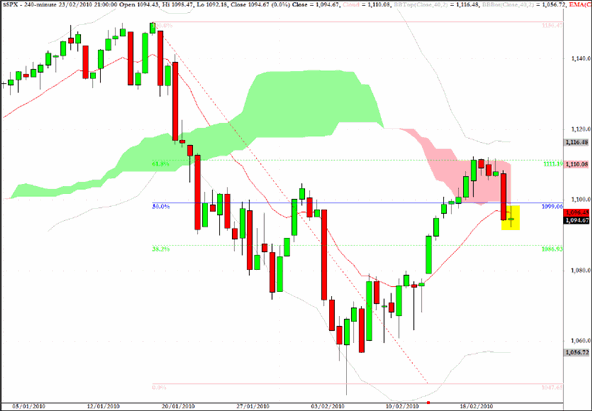
The chart for the S&P 500 index ($SPX) reveals the coincidence of key technical levels discussed here recently.
The 1110 level represents the 62% retracement of the swing high/lows for the year to date and also coincides with the top of the cloud formation on the 240-minute chart. (Used more often for FX trading, I am becoming quite a fan of the 4-hour charts for equities and indices as well)
The index has failed to penetrate the top of the pink cloud at 1110 which was exactly my intuition expressed here last week. The doji star left after yesterday’s retreat on the poor consumer confidence data is just below the 50% retracement level, also has notably slipped below the pink cloud and thirdly registered a close below the 50-period EMA as well.
While none of this is encouraging for the bulls, the candlestick pattern suggests that there is still a lot of indecision about the near-term direction, and as I suggested here on Monday I do not have a lot of conviction in trading this index at present. A drop below 1085 would tip the balance in favor of the short side but for now I am refraining from position trades in the broad US equity indices.
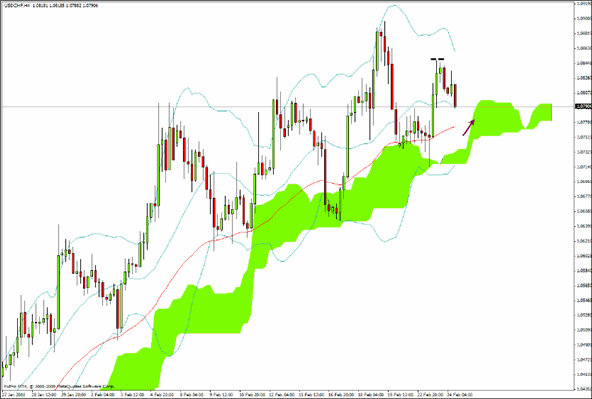
The weak consumer confidence data, and the likelihood that Chairman Bernanke’s testimony later today will reiterate the need for ZIRP (zero interest rate policy) in the near term, could keep the US dollar on the back foot during the North American trading session.
In particular, I shall be monitoring the USD/CHF chart to see whether the dollar can bounce off cloud support in the vicinity indicated by the arrow on the chart, or whether a correction in the dollar’s ascent may be looming.
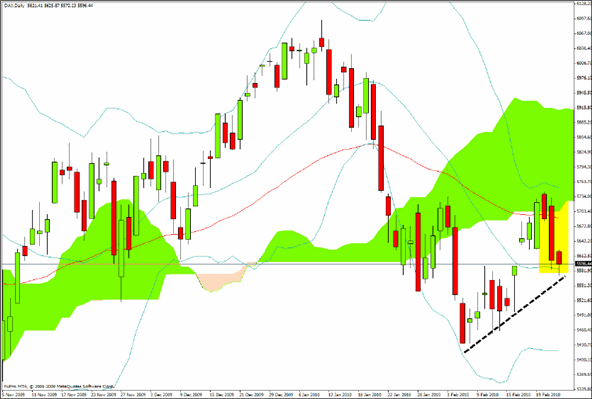
The DAX failed to maintain its foothold above the 50-period EMA and, after falling out of the cloud has experienced two days of weakness. There is a key trendline through recent lows indicated on the chart, and I suspect that if this is violated we should expect to see this index re-testing the low values seen in early February.
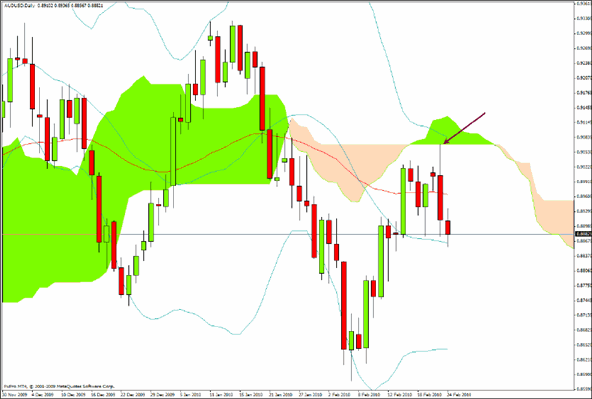
Notice how the Australian dollar tagged the base of the cloud formation and immediately reversed.
In placing profit targets and stop loss levels I am becoming more convinced that the presence of cloud formations on daily and 240-minute charts is about the best guide that I have found. This is especially teh case when there is a co-occurrence of cloud boundaries and other indicators such as volatility (Bollinger) bands and key EMA levels.
This was the comment in the newsletter for February 19.
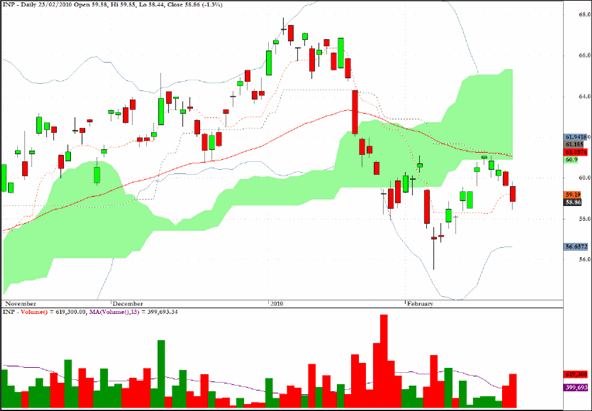
The India Fund (INP) is struggling to re-enter the cloud formation and looks vulnerable.
Another comment from February 19th’s newsletter:
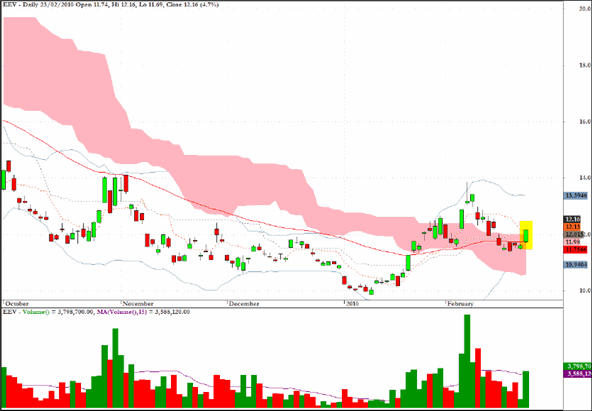
I would not be a buyer of BRIC related sector funds at this point and when the correction resumes, which I expect to be quite soon (today?) then there is a lot of scope for further profit on the short side. For aggressive investors it might even be worth considering the sector fund EEV which is an inverse version, with two times leverage, of the MSCI Emerging Markets Index.
The following comment comes from the commentary of February 17.
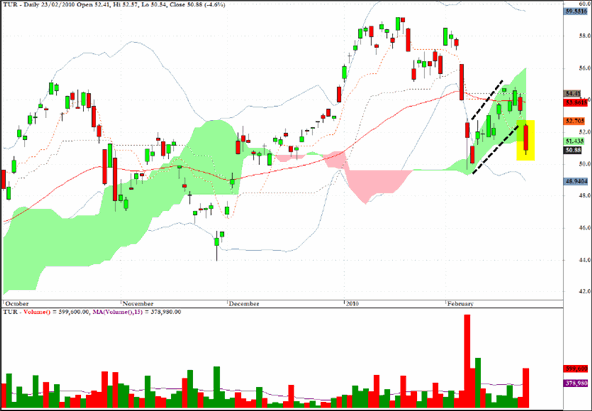
TUR, a sector fund which tracks Turkish equities, has a remarkably well formed bear flag pattern, but as is always the case with this pattern, patience is a virtue and the desired directional breakdown may not be immediate.
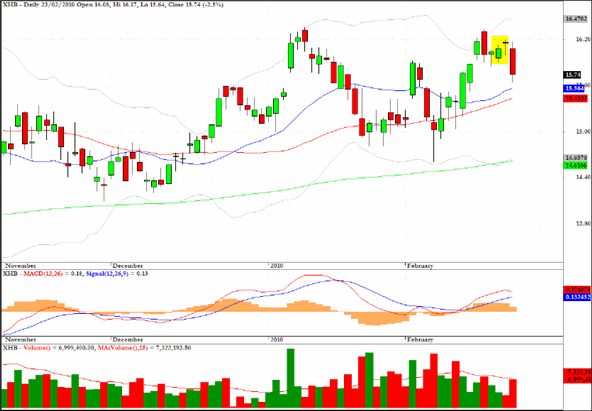
XHB, the sector fund comprising homebuilder stocks, is showing some negative divergences.
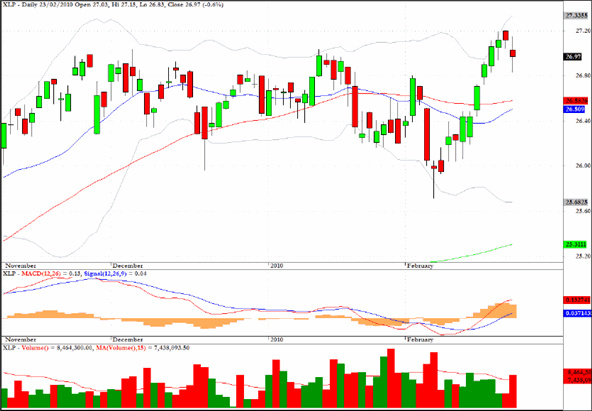
XLP, which tracks consumer staples stocks, made a nominal new high in recent sessions but there was little conviction behind the move. The recent earnings report from Campbell soup indicating that its premium branded soup is not selling as well as anticipated acts as a reminder that generics in food staples are increasingly being used as substitutes where the economic recovery, such as it is, is characterized by a lack of purchasing power for a large number of mainstream consumers.
Clive Corcoran is the publisher of TradeWithForm.com, which provides daily analysis and commentary on the US stock market.
|