| Corcoran Technical Trading Patterns For February 26 |
| By Clive Corcoran |
Published
02/26/2010
|
Stocks
|
Unrated
|
|
|
|
Corcoran Technical Trading Patterns For February 26
In yesterday’s US trading the first part of the session was in effect a well-orchestrated ambush by the bears to spook the prop trading desks and funds which have been playing the reflation/cyclical recovery theme.
Weakness in Europe from more abysmal data in the UK relating to very weak business investment, ongoing headaches about Greece and a plunge of 2 cents in sterling as well as several other currency pairs testing fairly critical levels was also infused with worst than expected unemployment claims in the US.
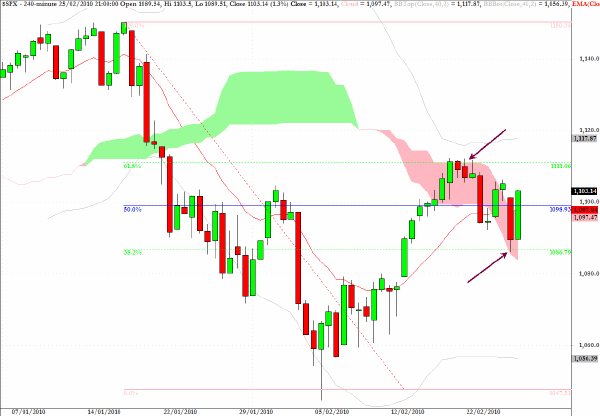
The result was a large opening gap downwards which brought the S&P 500 index down to test key support at the 38% retracement level of the 2010 swing high/low.
Using the 240-minute chart, it can easily be seen how the second half of the session showed an almost perfect technical recovery to bring the index back above the 50% level.
In reviewing the coincidental levels of the Ichimoku pink cloud boundaries, the customary levels on the fibonacci grid, and the rather remarkable reversal in the second half, I find it hard to resist the conclusion that the US equity market is more or less completely dominated by algorithmic trading programs predicated upon exploring the edges of market mayhem and then mounting last minute rescues.
It reinforces my view that there is little to be gained, for the time being, in position trading this index (i.e. holding on to positions overnight) but rather going with the intraday flow and reversing when key technical levels (clouds and fib levels) are tagged.
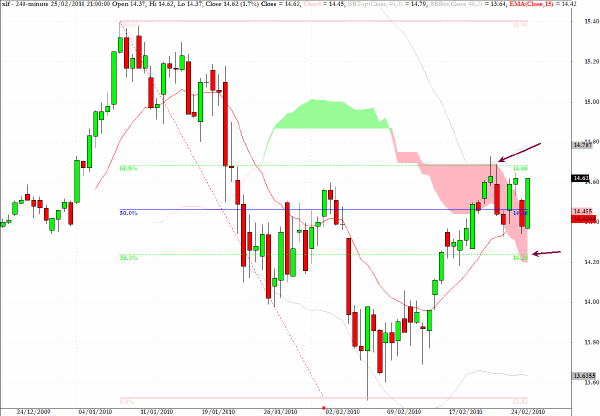
To underline the analysis provided above there is a remarkable similarity between the S&P 500 4-hour chart and that for XLF, the exchange traded sector fund for financial services.
In particular notice how the top of the pink cloud on the 240-minute chart coincides exactly with the 62% retracement level and the 38% retracement level with the base of the cloud.
As we are right in the middle of this zone with a bias towards a test of the upside, it would also be advisable to wait until this gridlock is broken - one way or the other - before trading this fund aggressively.
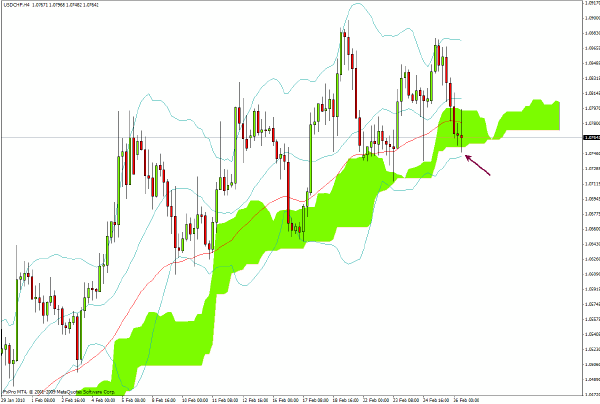
Earlier in the week I commented that I could sense that the US dollar rally was becoming over extended and pointed to the key levels on USD/CHF. As this is being written the dollar has retreated to the base of the cloud as indicated, and after yesterday’s firm attack designed to break certain support levels on the AUD, JPY and EUR seems to have temporarily failed I would suggest that today’s action in US/Swiss is once again where to get one cues for the near term direction of the US currency.
I had expected the dollar to make it to 1.10 but it did spike up to 1.09 in recent sessions and that may be the background for some consolidation before renewed progress for the greenback.
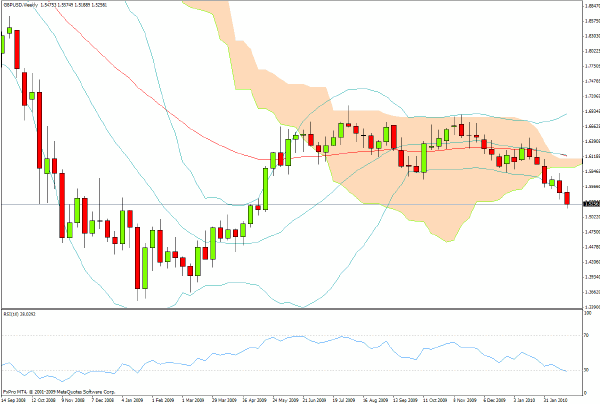
Sometimes one cannot resist saying I told you so - here are comments from a week ago.
The economic data coming out of the UK is unrelentingly abysmal...
In some quarters, there is an atmosphere of nonchalance and unreality about the current predicament facing the UK government’s balance sheet - which is just as bad as that of Greece but where pre-election spin and ostrich economic policy are lulling a domestic audience into a false sense that it will all be managed by the financial technocrats.
External investors are far less sanguine and as the long term chart for GBP/USD reveals sterling is losing its grip with hundreds of pips of gains ahead for those that want to sell this currency pair.
I am tempted to say that longer term GBP/USD will break below $1.50, but with this currency pair, remarkable drops can occur even while taking a comfort break.
Figures released in the UK this morning showed that the Q4, 2009 GDP figure was revised from a 0.1% gain to a slightly better 0.3% gain. I remarked, somewhat tongue in cheek, earlier that Gordon Brown might just see this as providing a tiny window of good news (until the next adjustment comes out which could see the number revised back down again) and decide to call for an earlier election than currently projected for May.
Not that I would claim to have any insight into the minds of politicians, something about which I am not alarmed at all, but their judgments and ability to misread most things does provide some of the more amusing distractions in the current rather somber climate, as this article from the BBC reveals:
Greek Deputy Prime Minister Theodoros Pangalos has accused Germany of failing to compensate Greece for Nazi occupation during World War II.
Mr Pangalos made the remarks during a wide-ranging BBC interview about Greece’s financial difficulties.
"They [the Nazis] took away the Greek gold that was in the Bank of Greece, they took away the Greek money and they never gave it back," he said.
Germany has rejected the allegations, describing them as "not helpful"
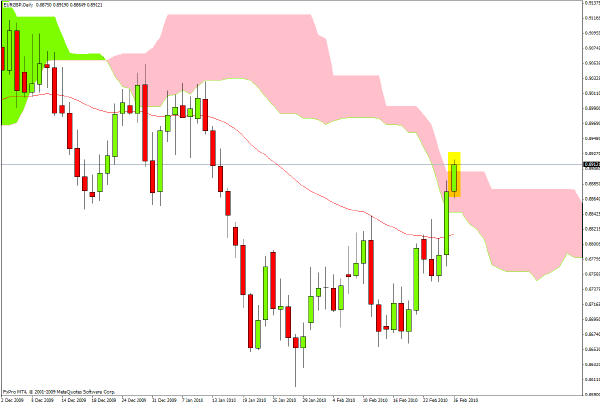
How does this relate to the chart below for EUR/GBP? This was also a question posed to me by a reader via Twitter earlier.
The break above the pink cloud at the 0.89 level for the euro against sterling is I believe indicative of a longer term bullish or long position for EUR/GBP. Simply translated, in the current context, means that I believe that while both the euro and sterling will go lower against the dollar, I believe that sterling has the capacity to outpace the euro on the downside.
I have however this morning gone flat after taking gains on the break above 0.89 as it would not be unsurprising to see a revisit within the cloud first.
There may not be such consolidation but I have usually found that it is better to initiate positions before there is a break above/below clouds and then to take initial or half profits at the breakout and then wait for a pullback to re-establish new positions.
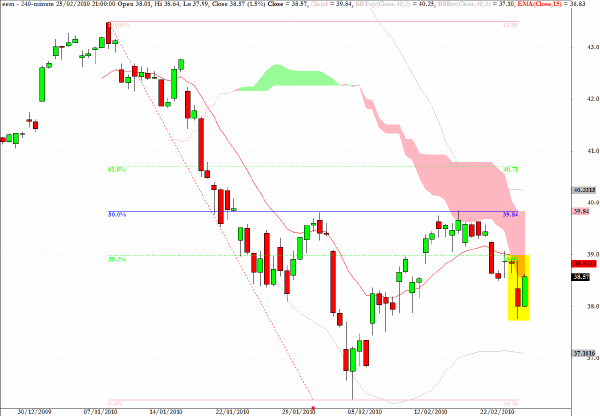
Extending the theme developed in the first two charts of today’s commentary the chart below is for the EEM sector fund which tracks the MSCI Emerging Markets Index. Once again a 240 minute version of the chart has been used and one can notice the similarity in the cloud formations and key fibonacci grid levels.
However also evident on the chart is that EEM is struggling to gain a foothold above the 38% retracement level and has also encountered resistance at the base of the cloud.
From a relative performance perspective this suggests that, contrary to much hoopla about the buoyancy of the new economies, the US indices are currently exhibiting greater relative strength than some of those markets which require a greater predisposition to adventurous risk taking.
On a spectrum of risk aversion/risk adventure, it still seems the case that fund managers are playing more cautiously now than they were in the latter part of 2009 and that the deflation/weak economic recovery theme is weighing on the de-coupling thesis.
Clive Corcoran is the publisher of TradeWithForm.com, which provides daily analysis and commentary on the US stock market.
|