| Corcoran Technical Trading Patterns For March 2 |
| By Clive Corcoran |
Published
03/2/2010
|
Stocks
|
Unrated
|
|
|
|
Corcoran Technical Trading Patterns For March 2
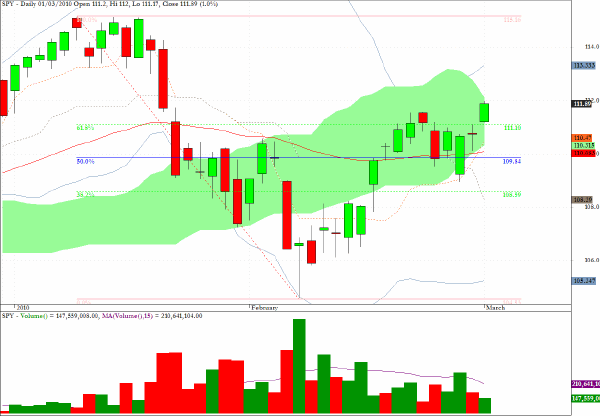
SPY moved beyond the 62% retracement level - as the S&P 500 cash index moved through 1110 and closed at 1115 - and if the peek above the cloud is sustained with a definite close above that cloud in today’s session the presumption is that the previous high from early January - around 115.50 on the SPY instrument - will be the short-term target for the bulls.
On a cautionary note, the lower chart segment below reveals that the move yesterday was not widely supported from a volume perspective, with the daily volume registering only about 2/3 of the average daily volume. And this is to be seen in terms of subdued volumes throughout the trading year to date.
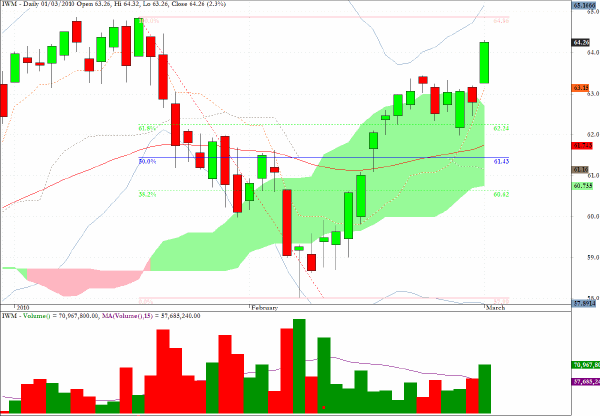
IWM, the proxy for the Russell 2000, has been behaving more bullishly with greater volume participation and seems destined to test the upper boundaries of the range which has been in place so far in 2010.
The strong performance of the high-beta stocks reveals how quickly traders can overcome concerns about Greek government bonds and reining back risk - as was in evidence throughout much of February - and leap back into the micro-cap universe of equities where the bounce potential is most advantageous as the overall market moves ahead. The question is - will the Russell 2000 be able to slice through 650 and move to a new multi-period high or will the still precarious situation with regard to the Eurozone take another turn for the worse?
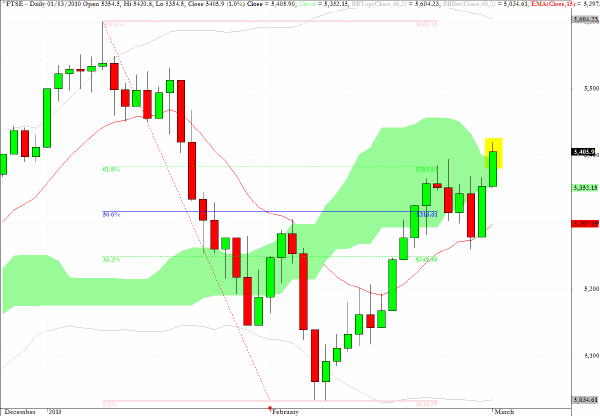
Despite a plummeting currency, the possibility of political gridlock and some still dismal economic news, the FTSE has also made progress to the top of the cloud formation.
Two closes above the green cloud formation, and in turn the 62% retracement level, would encourage me to believe that this rally has the potential to move back towards the previous high from early January.
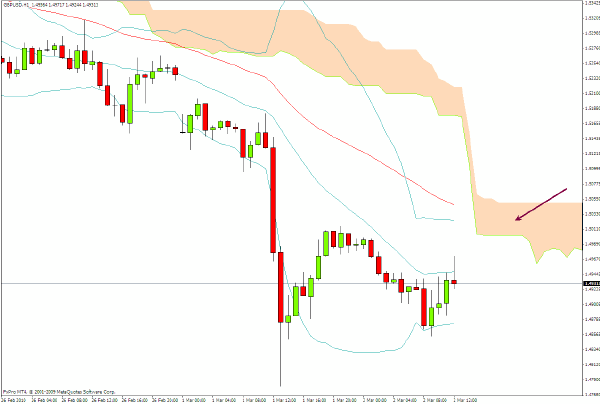
Sterling dropped below $1.48 in trading during the last 24 hours and underlines my belief that shorting the UK currency surely has to be one of the easiest ways to make money consistently in the financial markets.
The 60-minute chart below suggests that a rally back towards $1.5050 seems likely at which point new short positions would be more appealing again. Intermediate term targets have to be adjusted now to $1.45 and then an area of stronger support in the $1.4250 region.
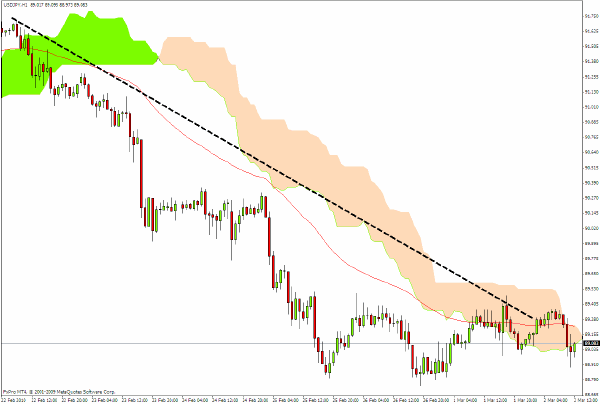
USD/JPY has bearish wedge formations in almost time frames ranging from the weekly to the daily and the intraday patterns. The possibility of a break above the cloud formation on the 1 hour chart has to be considered from a risk/reward perspective. The downside would appear to be relatively easy to confine, whereas a break out of the wedge would mean that there would be little or no short term resistance until the 90.50 level is reached.
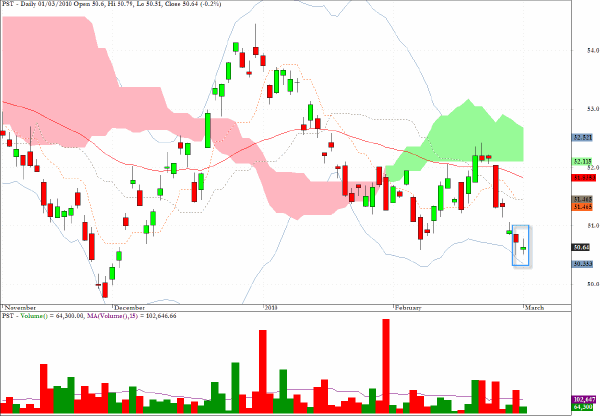
PST, would be one of my preferred long candidates in today’s session. Interestingly, while the long side is preferred this fund corresponds to twice the inverse of the daily performance of the Barclays Capital 7-10 Year U.S. Treasury index.
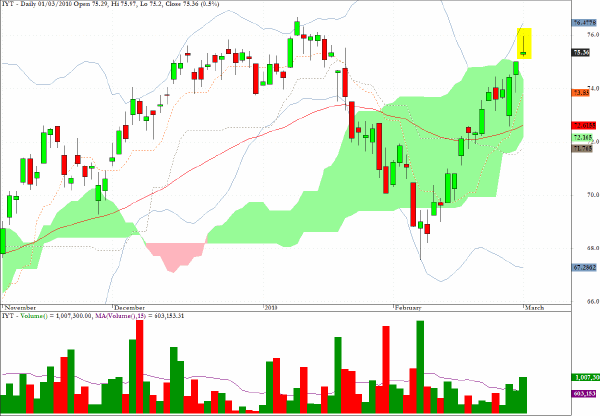
IYT, an exchange traded fund, which tracks the DJ Transportation index registered a small shooting star pattern after a gap up which has also to be considered in the context of rejection as the high almost reached back to the January high.
It would be worth monitoring this fund for evidence of an intermediate term possible double top formation.
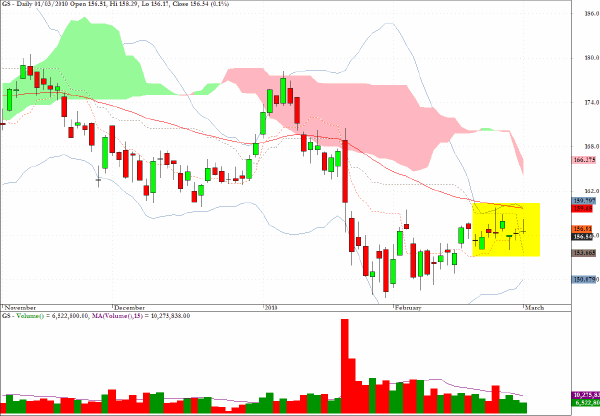
Goldman Sachs (GS) is registering a succession of tiny star formations and the pattern still has the look of an extended pullback from the sharp sell off in the latter part of January.
Also noteworthy is the subdued volume on this chart which suggests that institutional investors are not piling into this stock as enthusiastically as one would expect given the fact that the firm’s prop trading activities continue to be without equal. Perhaps there is a concern that the US Treasury will be investigating the firm’s collaboration with Club Med governments more fully and show more diligence in such inquiries than it has shown previously.
Clive Corcoran is the publisher of TradeWithForm.com, which provides daily analysis and commentary on the US stock market.
|