| Corcoran Technical Trading Patterns For March 8 |
| By Clive Corcoran |
Published
03/7/2010
|
Stocks
|
Unrated
|
|
|
|
Corcoran Technical Trading Patterns For March 8
The following comment from my blog seems rather appropriate to describe the nature of action during last week.
More and more we have markets that go up primarily because of short covering by over-zealous bears who get too confidently pessimistic during the RISK OFF phase of the game, and go down when the hedge funds enjoying the RISK ON phase get too cocky.
Last week saw the re-emergence of risk appetite mainly as a reaction to the apparent resolution (at least in the near term) of the Greek debt crisis and the fact that the US payroll data was not as weak as some had feared because of adverse weather.
As anticipated, major equity indices now seem to be gearing up towards re-testing January highs - with the UK’s FTSE in the vanguard as forecast here in last week’s commentary. Actually the Daily Form crystal ball has been working rather well recently with several of the less obvious calls rewarding generously.
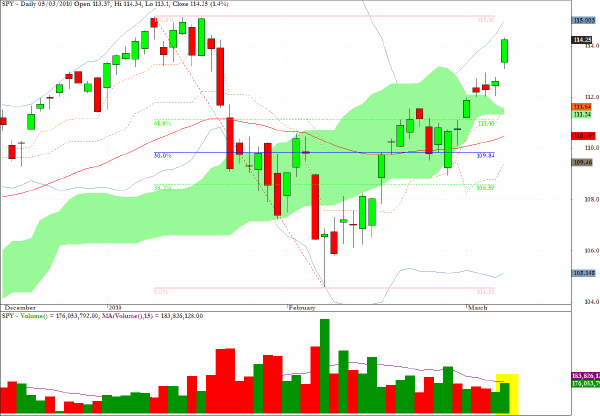
The chart for SPY shows that the break above the cloud and 62% retracement level was the technical development which helped trigger the renewed enthusiasm for this benchmark index. Even the volume on Friday managed to just equal its 15-day moving average. Not exactly a resounding endorsement of the new risk ON sentiment but we’ll take it as better than a decline in volume to celebrate the "positive" NFP data.
Few mentioned the fact that the U6 data actually deteriorated, showing that almost 17% of the US work force remains under-employed, but it would seem that the glass is looking half full again for most of the pundits, and it’s often better to just go with the flow.
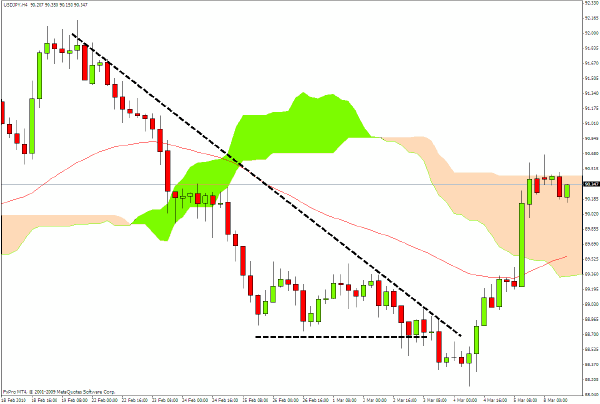
Sometimes, despite my modesty, even I cannot refrain from trumpeting a particular comment. This comes from my commentary last week on USD/JPY.
The possibility of a break above the cloud formation on the 1 hour chart has to be considered from a risk/reward perspective. The downside would appear to be relatively easy to confine, whereas a break out of the wedge would mean that there would be little or no short term resistance until the 90.50 level is reached.
Notice how the high on the chart, following the explosive breakout, was 90.52.
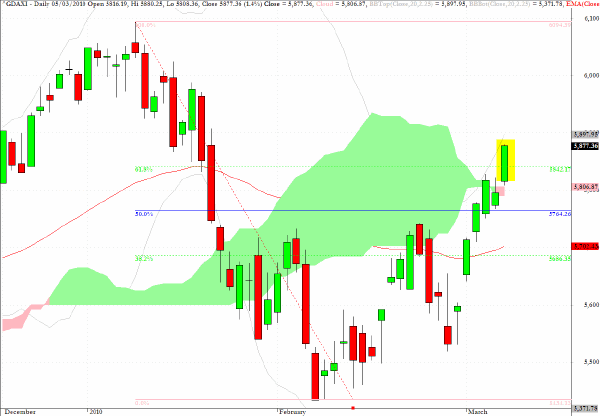
Germany’s DAX index has been outpaced by the UK’s FTSE which managed to close within a whisker of its January high on Friday.
The UK index allows much greater exposure - through its strong contingent of mining and commodity related stocks - to the new risk appetite, and it doesn’t detract from matters that for a global asset allocator the currency of account for settling purchase of FTSE index futures or stocks - has been getting more attractive on a relative basis as sterling weakens.
Of course it could weaken a whole lot further - but surely that would make the index even more favorable to macro hedge funds wouldn’t it?
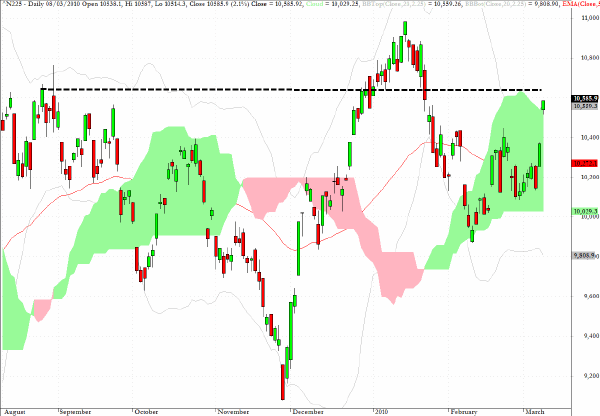
The Nikkei 225 celebrated the weakness in the yen as well as the improvement in sentiment towards risk by a strong opening gap which brought the index almost exactly to the 10,600 level.
The move up towards 11,000 would seem to be almost a certainty and if the Japanese yen continues to lose ground this may well be seen, just like the case of sterling and the FTSE, as another positive for Japanese equities.
Just one small snag could present itself in the longer term which is the fact that the debt/GDP ratio in Japan is by far the highest in the G20 countries, and if domestic investors decided to get a little more bullish about switching into home-grown risk assets, this could mean the end of the Japanese government being able to sell mountains of debt to its own citizens with coupons of little more than one percent.
But that will only become a problem if, and when, the action in the Nikkei 225 becomes a lot more frothy than at present.
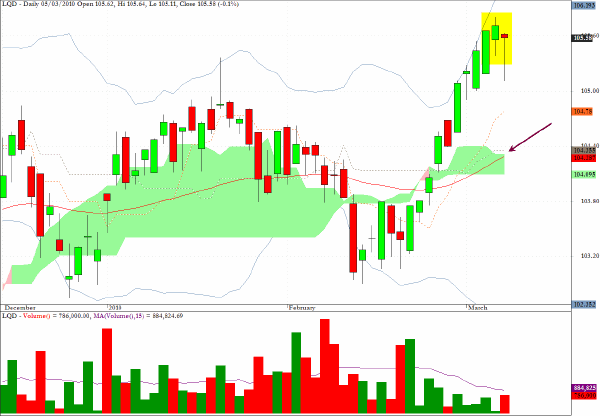
While there are several equity sectors that are beginning to look overstretched - specifically consumer related - the real opportunities, as there are more signs of life in the animal spirits, are on the short side of parts of the fixed income sector. While high yield bonds may benefit, investment grade bonds will come under pressure as the shape of the yield curve begins to reflect the view (probably mistakenly) that there may finally be an end to the days of ZIRP.
As PIMCO’s Bill Gross commented recently the decision to start removing at least parts of the Fed’s monetary easing may well turn out to be a policy error, but those in the market who believe that we are in the early stages of a normal cyclical recovery are expecting a tightening and this is being reflected in the fed funds and eurodollar futures markets.
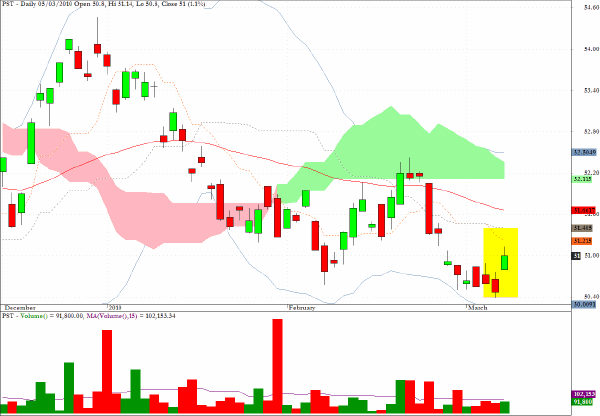
I shall repeat my comments from last Thursday’s newsletter
PST, would be one of my preferred long candidates in today’s session. Interestingly, while the long side is preferred this fund corresponds to twice the inverse of the daily performance of the Barclays Capital 7-10 Year U.S. Treasury index.
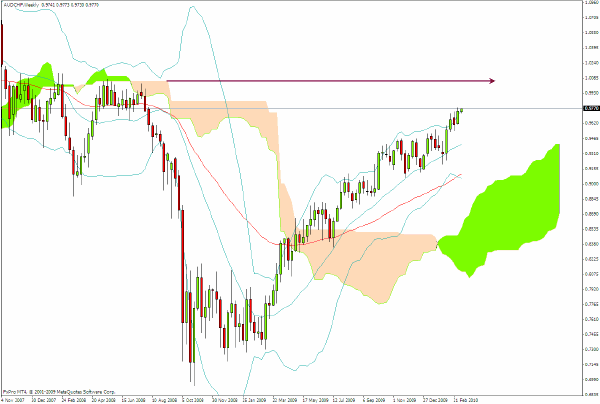
There is a rather quaint expression among some veterans of the capital markets that "Nobody rings a bell at the top".
Although there may be no bells, sometimes charts send pretty good warning signals. The chart of the AUD/CHF currency pair - one of the less discussed carry trade pairs - is reaching back to levels seen two years ago before the Armageddon constituency moved into high gear.
As this pair reaches toward the level indicated on the chart I would suggest that the latecomers to the equity rally party should be wary. Having said that, we all know that the latecomers never are wary and that is why markets will usually overshoot to the upside.
Just as a reminder of my 2010 outlook - which was more an exercise in end of year largesse than any display of visionary skills - there was a call that 1280 could be a target on the S&P 500 this year. There may be a sufficient respite from sovereign debt worries over the next few weeks to get the bulls charged up enough, with enough RISK ON animal spirits, to still make that a possibility.
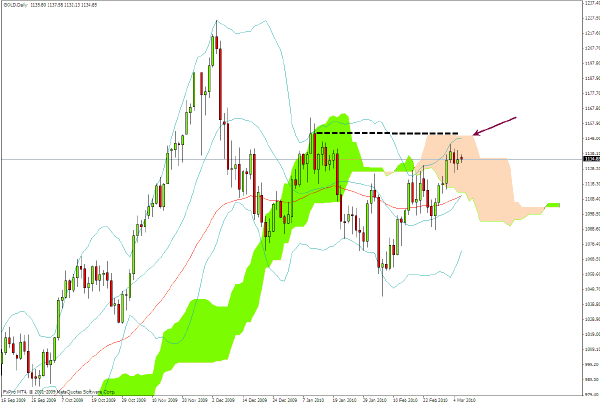
I remain intrigued by the chart for spot gold which is somewhat defying the scepticism of many soothsayers by refusing to sell off.
The 1140-1150 remains a key zone for the metal, and if the rally in equities continues, with an accompanying wall of worry about sovereign debt risk, then a break above 1150 could easily set up a rather abrupt rally into the $1200 plus price zone.
Clive Corcoran is the publisher of TradeWithForm.com, which provides daily analysis and commentary on the US stock market.
|