| Corcoran Technical Trading Patterns For March 9 |
| By Clive Corcoran |
Published
03/9/2010
|
Stocks
|
Unrated
|
|
|
|
Corcoran Technical Trading Patterns For March 9
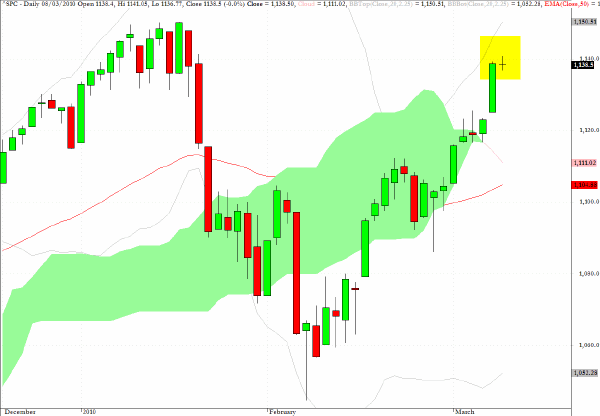
The high-spirited reaction to Friday’s NFP data faded fairly rapidly as trading in equities during the North American session on Monday could best be described as lackluster, with volume on the SPY limping in at only 2/3 of its already subdued moving average levels.
As suggested several times, the price action and the Ichimoku cloud formations are all suggesting further upward progress for US equities, but the volume does leave a large question mark over the conviction behind the recent rally.
The tiny doji star pattern highlighted on the chart for the S&P 500 cash index also suggests that, as is not infrequently the case, we could be preparing for a turnaround Tuesday session. There are other suggestions from the foreign exchange market this morning in Europe that the risk appetite and animal spirits that were much in evidence last week, and which I discussed in yesterday’s column, may have got slightly ahead of themselves.

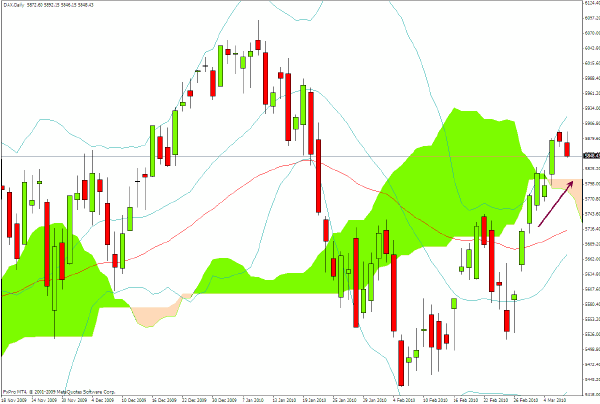
The DAX index should find buying support at the 5800 level as indicated on the chart below.

An opinion poll, released in The Times of London this morning, shows that there is virtually a dead heat between the Labour and Conservative parties with respect to the voting intentions of a sample of voters in key marginal constituencies for the forthcoming UK election.
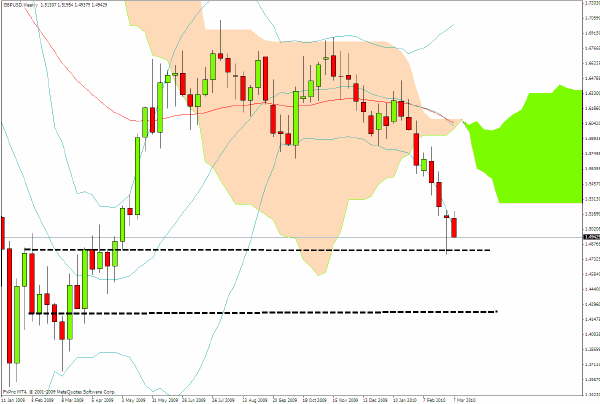
This has produced yet another notable selloff in sterling and reactivates the targets for the UK currency in the mid $1.40’s in the near term with an intermediate-term target of approximately $1.4250.
If sterling breaks below the $1.4780 level seen last week and enters into the zone between the two dotted lines, then I sense that there will be even more erratic behavior than normal for this accident-prone currency.

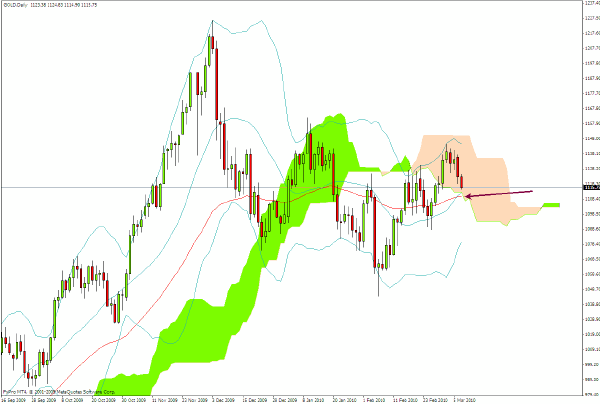
I tempered my relatively benign view of gold, expressed here last week and again yesterday, with the qualification that the $1140-1150 level would pose a significant hurdle for the precious metal.
However, I admit to being surprised by the sharp setback in spot gold during the last 24 hours and am now looking for where support needs to hold for the intermediate-term view to remain positive.
On the chart below there is, in the vicinity of $1108, a coincidence of cloud support and the 50-day EMA.
The current pullback can still be seen as further evidence of the longer-term fractal formation of deeper corrections followed by shallower ones (i.e. the archetypal cup and handle patterns).
I shall be looking to re-establish a long position close to the $1108 level with the view that a resumption in the uptrend in equities will help to propel the metal back towards $1140 - at which point the bulls will have to demonstrate more vigorous conviction as another failure at this level would constitute a bearish development.

Clive Corcoran is the publisher of TradeWithForm.com, which provides daily analysis and commentary on the US stock market.
|