| The Wagner Daily ETF Report For March 12 |
| By Deron Wagner |
Published
03/12/2010
|
Stocks
|
Unrated
|
|
|
|
The Wagner Daily ETF Report For March 12
After a slightly weak open, stocks pushed modestly higher before stalling out around 11:00 am. The main averages then consolidated for the next few hours before breaking out to new intraday highs in the final hour of trading. The strong finish allowed the broad market averages to close at the highs of the day, gaining between 0.3% to 0.5% across the board. The recent breakout action in the small and mid-cap averages has been impressive, as they continue to extend beyond their prior highs. The Nasdaq breakout is also in full gear. Though we are not looking to the S&P 500 or Dow for leadership, we'd like to see these averages confirm by breaking out to new highs as well. The S&P 500 hit a new closing high for the year (by one penny), but did not break through the prior high. The Dow Jones Industrial Average closed about 1% off the prior high.
Total volume dropped off the prior day's pace by 14% on both exchanges. It is tough to find the negative in a light volume rally day when the current trend is so dominant. Market internals were average at best, with advancing volume beating declining volume by 2.5 to 1 on the NYSE and 1.5 to 1 on the Nasdaq.
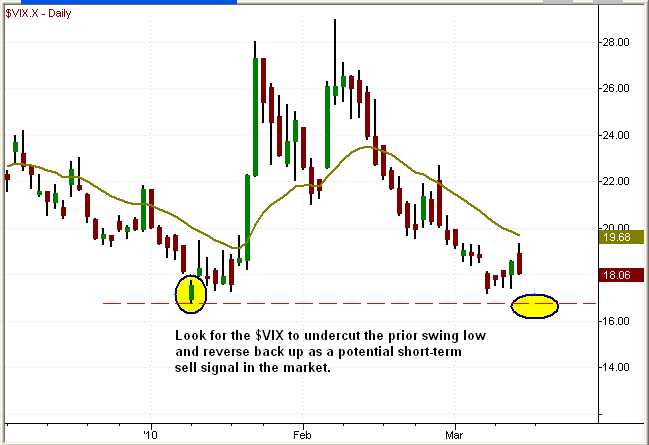
We start off with the CBOE Volatility Index ($VIX) once again today. As mentioned yesterday, there is the potential for a double bottom to form on the daily chart below.

We could see a possible undercut scenario develop, where the price action probes below the prior swing low (around 18.00) and quickly reverses back above. This type of sharp reversal action could function as a clear warning sign for the bulls to exit longs and wait for a short-term pullback in the broad market averages.
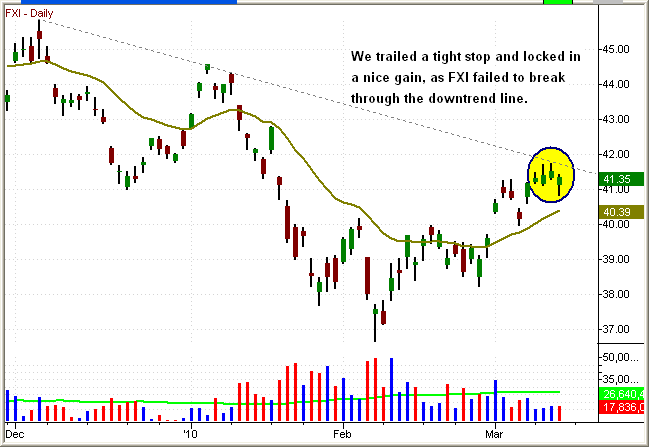
FXI triggered our adjusted stop price of 41.04 yesterday, allowing us to lock in a nice profit.

We made a judgment call to raise our stop and protect profits as FXI backed away from the downtrend line. We'll look to re-enter the position if/when the price action can break back above resistance of the downtrend line.
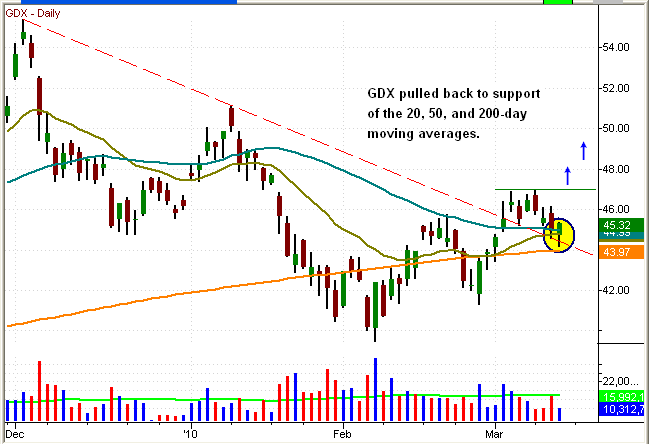
Our existing long position in Market Vectors Gold Miners (GDX) put in a strong reversal yesterday after undercutting support from the 20 and 50-day moving averages in the first hour of trading. There is additional support from the 200-day MA around 44.00, as well as the downtrend line it broke out from last week. We look for the price action to hold above 44.00 and push higher next week. A close above 47.00 will confirm the downtrend line breakout.

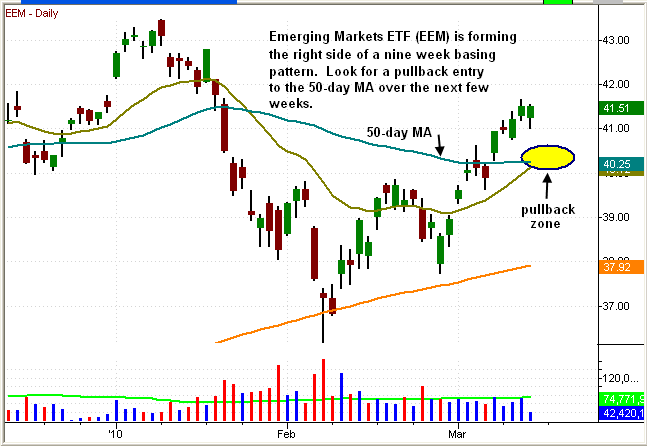
The iShares Emerging Markets (EEM) is forming the right side of its basing pattern after reclaiming the 50-day moving average last week. Look for EEM to eventually pull back and test support of the 50-day MA and the rising 20-day EMA, somewhere around the 40.25 - 40.50 level.

The broad market continues to push higher while most traders anticipate a correction. Our overall thoughts going into today remain the same; play the bullish momentum as it lasts, but maintain a vigilant watch on open positions, including the use of trailing stops to protect gains along the way.
Open ETF positions:
Long - KCE, GDX
Short (including inversely correlated "short ETFs") - none
Deron Wagner is the Founder and Head Trader of both Morpheus Capital LP, a U.S. hedge fund, and MorpheusTrading.com, a trader education firm.
|