| Corcoran Technical Trading Patterns For March 15 |
| By Clive Corcoran |
Published
03/15/2010
|
Stocks
|
Unrated
|
|
|
|
Corcoran Technical Trading Patterns For March 15
Friday’s action in US equities produced several candlestick patterns which can be characterized as hanging man formations. Given that they occurred at or very near to multi-period highs, there is a suggestion that the market may be struggling to find new excuses to push higher in the immediate term.
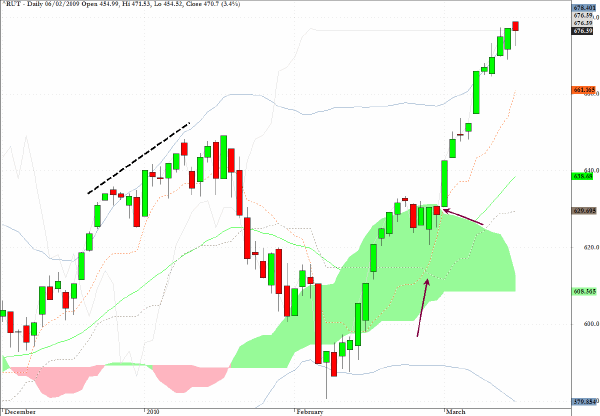
The chart below for the Russell 2000 exemplifies the pattern just alluded to, and underlines my comment from last week that high beta may not be the best place to be while the market deliberates on how much further it wants to push into higher ground at present.
Just as a point of interest and to illustrate the benefits of the Ichimoku pattern analysis which I have become more reliant upon, there are two arrows marked on the chart which gave excellent buy signals for this index in February and suggested that the bulls had taken control of the agenda even when the world was worried about Greek defaults and Chinese tightening.
The leftmost arrow shows a crossing of what is called the Tenkan Sen above the Kijun Sen when price was within a cloud formation. This bullish indicator was validated within three days as the right most arrow shows the index piercing decisively through the cloud and setting the tone for the most recent recovery in equities.
As previously suggested one has to go out to the monthly charts for guidance on where there could be cloud resistance and it is in the neighborhood of 685 which also represents the uppermost Bollinger bands on the daily charts.

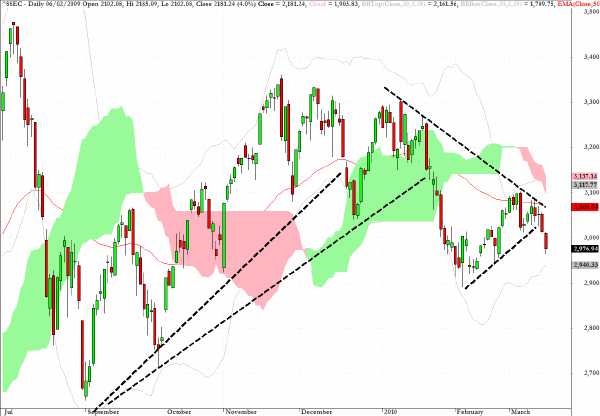
It is hard to be bullish on the daily chart below for the Shanghai Exchange as several up trend lines have been broken and the most recent formation looks like a broken bear flag which could see a retreat to the 2900 level.

Friday’s FX action saw a lot more attention to testing levels on cross rates without a primary focus on the US currency as one of the pairings. Of course all rates will ultimately have ripple effects which will impact the dollar but the point I am making is that, if and when say, traders are not especially determined to test a key GBP/USD rate then there will be a tendency to focus on such rates as EUR/GBP and GBP/JPY. This will often produce rather abrupt changes in the rate when quoted against the dollar but if the focus of the trade is with the other pair in the cross rate then the direction of the currency against the dollar becomes somewhat secondary to the profitability of the trade.
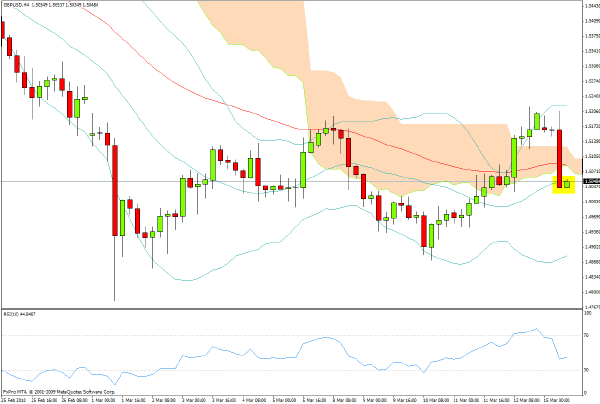
Sterling benefited in this manner against the US currency on Friday as there was a lot of short covering by traders who had shorted sterling against the euro and were busily buying sterling even as the GBP/USD charts were moving into resistance areas. Monday morning trading in Europe has seen the UK currency back testing the $1.50 level and it is hard not to be bearish on the currency based on the 240-minute chart below, especially as the RSI value has some ground to cover before it drops below the 30 level - a good place to cover short positions.

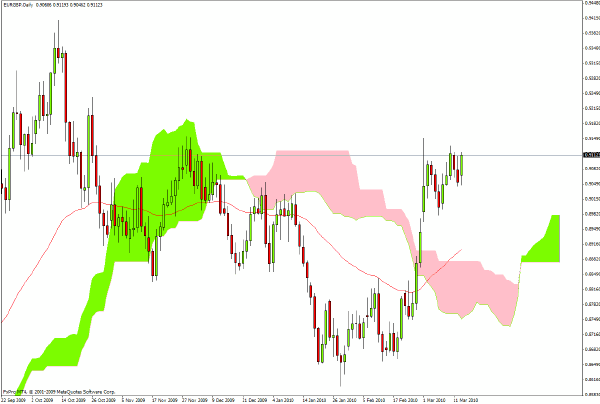
EUR/GBP behaved quite erratically on Friday but, as can be seen from the chart below, and in the context of the discussion above, the pair has moved back towards levels where the chart formation suggests that a break above .9150 on the cross rate will put the .9350 level back into contention.

Clive Corcoran is the publisher of TradeWithForm.com, which provides daily analysis and commentary on the US stock market.
|