Perhaps the FOMC statement to be released later today will act as a catalyst and provide a little more useful information about near-term direction.
The chart for QQQQ is providing precious little guidance about whether the surpassing of the January high will act as an impetus to further upward gains or bring about a period of consolidation.
The volume over the last two sessions is unusually anemic, and yesterday’s hanging man/doji star formation is indicative of indecision and lack of conviction on where to go next.
Perhaps the FOMC statement to be released later today will act as a catalyst and provide a little more useful information about near term direction. 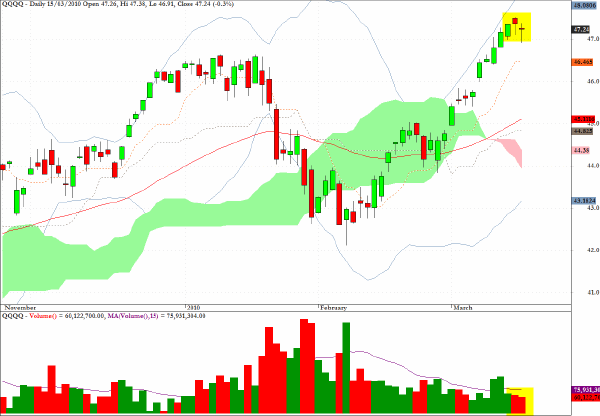
On the 240-minute chart for spot gold, a repeated pattern is revealing difficulties each time the metal achieves a pullback from selling bouts and encounters the 50-period EMA.
The arrow on the chart indicates where some further selling is to be expected. 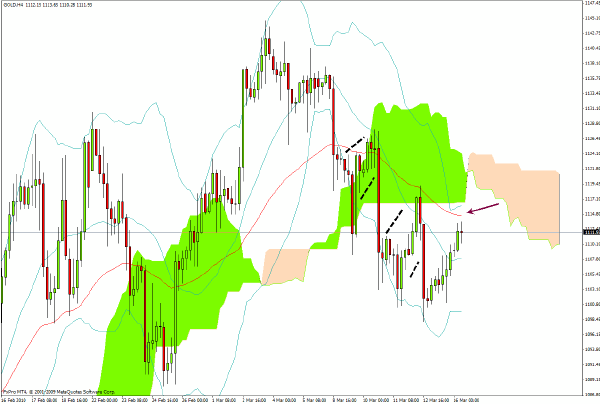
The Reserve Bank of Australia is indicating that the future course of interest rates remains upwards and this is helping the AUD/USD in early European trading. A break above the cloud formation and the descending trendline on the hourly chart below, which I suspect is imminent, would put targets around 9190, and perhaps beyond, in play. 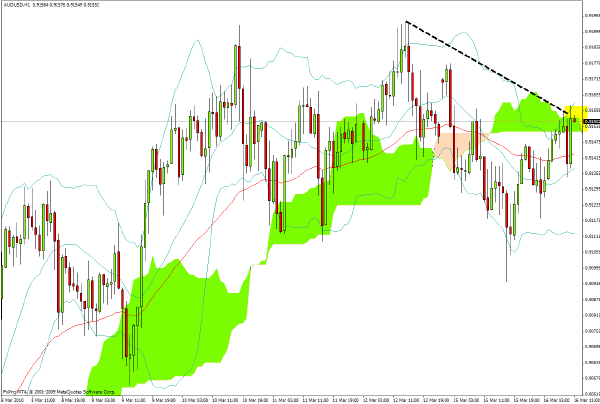
Alliant Tech Systems (ATK) looks vulnerable after registering a gravestone doji candlestick in yesterday’s trading. 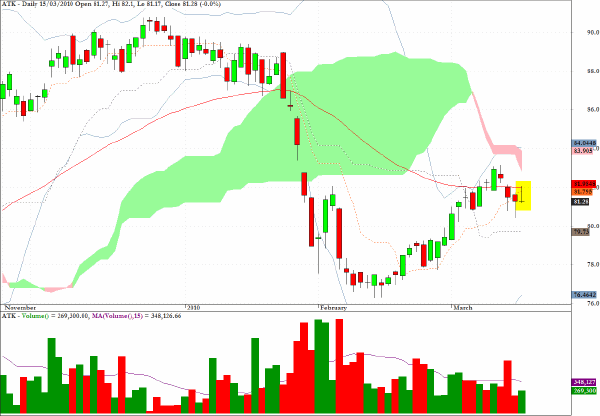
Eastman Kodak (EK) pushed away from a congestion zone on substantial volume in yesterday’s trading and could be about to exit the constricted volatility range which is evident on the daily chart. 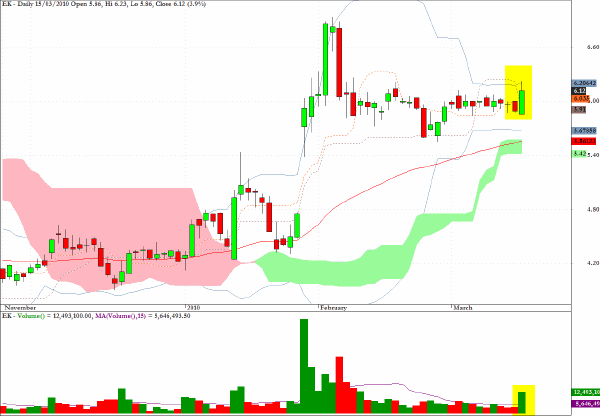
Clive Corcoran is the publisher of TradeWithForm.com, which provides daily analysis and commentary on the US stock market.