| Corcoran Technical Trading Patterns For March 19 |
| By Clive Corcoran |
Published
03/19/2010
|
Stocks
|
Unrated
|
|
|
|
Corcoran Technical Trading Patterns For March 19
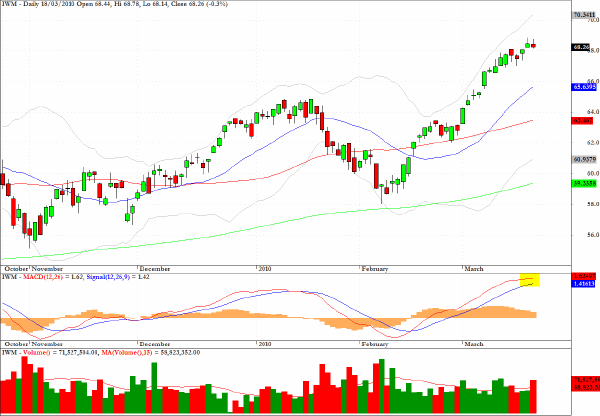
I have been warning recently that the Russell 2000 index appeared to be closing in on an important intermediate term target of approximately 685. The cash index closed yesterday with a gravestone doji star following Wednesday’s intraday high of 683.98.
The IWM proxy chart below indicates that the momentum which has propelled this index during the last four weeks appears to be topping out. In addition, several other sector charts are suggesting that equities are overstretched at this point. While I am not anticipating a major correction, the risk/reward calculus, I believe, is no longer in favor of the long side for most equity sectors in the near term.

In line with my commentary yesterday regarding the extraordinary situation with regard to the Greece rescue plans, the FX market is taking the path which often arises when it is completely confounded which is to sell the euro and ask questions later.
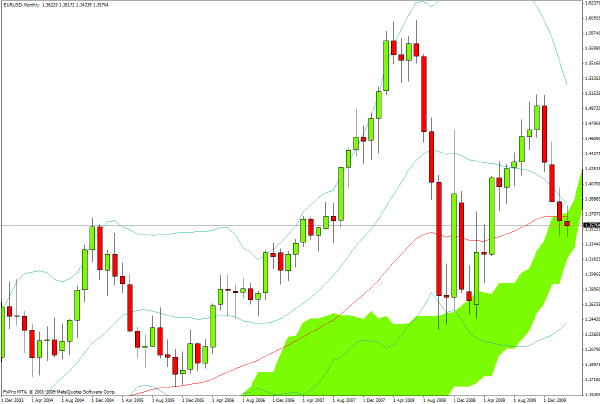
From a longer-term perspective, the monthly chart shows how precarious the positioning of EUR/USD is becoming as the exchange rate is about to encounter an upward sloping cloud formation where a break below the $1.34 level would remove any obvious layer of support and put the EZ currency at risk of eventually exploring levels in the $1.20’s.
The market will likely remain erratic as the newsflow about an EU rescue or an IMF rescue continues to muddy the waters but it would be a significant and bearish development if EUR/USD closes below $1.34 in North American trading in coming sessions.

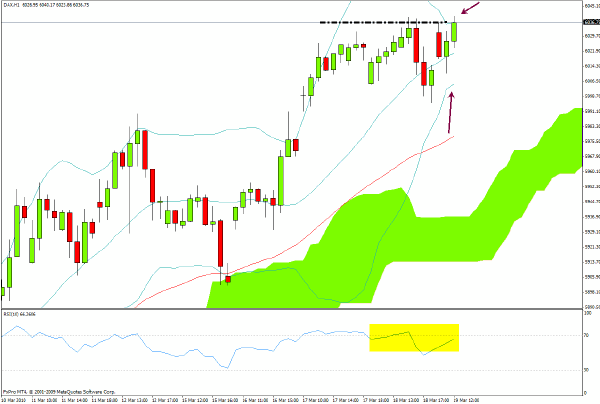
On the hourly chart, Germany’s DAX is looking like it is running out of steam as it attempts to move above the current top of the range which is virtually at the January high.
In particular, I would also point to the manner in which the Bollinger bands have tightened, as well as the RSI is showing divergences, and this suggests a breakaway move is imminent. We could well see a substantial move in this index in European trading this afternoon when the US markets open for business.

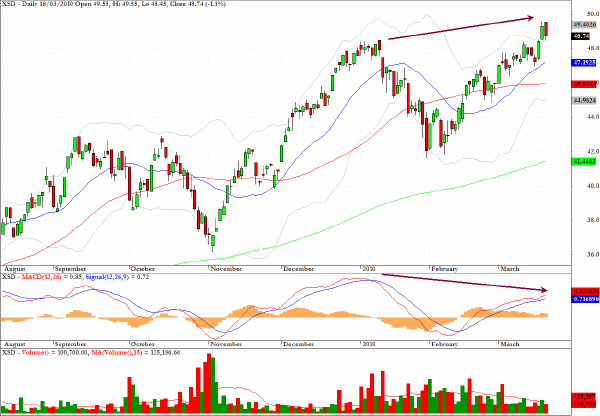
Among the sectors which are showing the most signs of momentum exhaustion, the semiconductors, as expressed in the chart below for XSD, are presenting not only a topping of the most recent MACD peak but also a negative divergence with the peak from the end of 2009 and beginning of 2010.

Clive Corcoran is the publisher of TradeWithForm.com, which provides daily analysis and commentary on the US stock market.
|