NASDAQ COMMENTARY
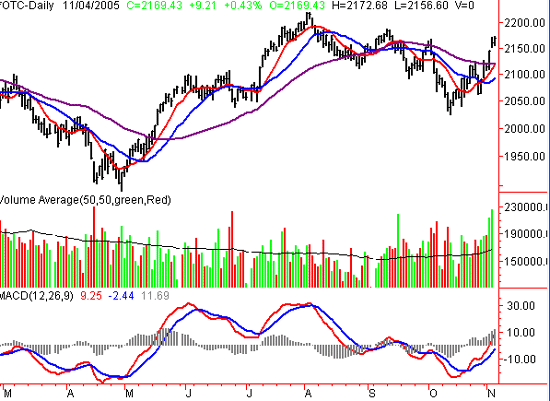
it was a rip-roaring week for the NASDAQ and it closed up 3.8%. Volume last week averaged about 17.1 million compared with 20.7 million this week. That gives us a boost of confidence and it looks like the buyers had some conviction behind their buying this week. It was actually the NASDAQ's relative strength against the S&P that set off a major bullish signal for us this week on Tuesday morning.
Let's look at this week's chart.
NASDAQ CHART - DAILY

As seen here, there were several bullish moves this week for the NASDAQ:
- it closed above it's 50 day line for the first time in over a month
- volume was much higher than the past few months
- it's relative strength against the S&P was enough to signal a bullish call
Traders should take note of the 2160 area which has been a major area of resistance for the index. We will likely be even more bullish once the index crosses over 2200, which hasn't happened since August and that was the first time in over 3 years.
S&P 500 COMMENTARY
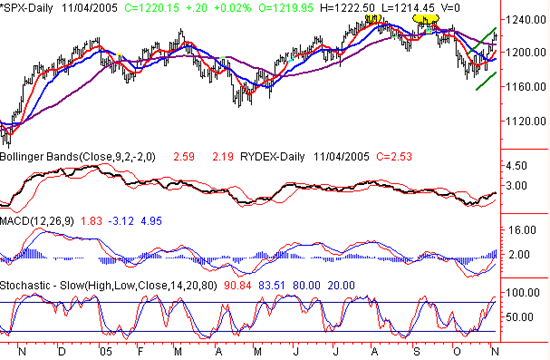
The S&P closed up 1.4%. One key indicator this week was the Rydex. It moved up bullishly and has begun to hug the upper band. We saw a similar pattern this past May and July which turned out to be quite bullish. The index has been trending up nicely since it's low on Oct 13 and with this week's move up on strong volume, things are looking rosy. A key area of resistance is the 1240 area. A break through this area would be very bullish indeed.
We should keep a sharp eye on stochastics readings this week. In the past year, this indicator has been a decent predictor of oversold and undersold conditions (oversold at 20 and overbought at 80). We at big trends usually like to buy when a stock or index is OVER 80 (technically in overbought territory). This is usually an effective technique when securities are entering big trends. Just take a look at late November of 2004 and Mid May 2005. These are 2 occasions where the stochastic line was screaming overbought as the index continued it's way up.
Overall, it was a bullish week for the S&P and we remain short-term bullish.
S&P 500 CHART - DAILY

DOW JONES INDUSTRIAL AVERAGE COMMENTARY
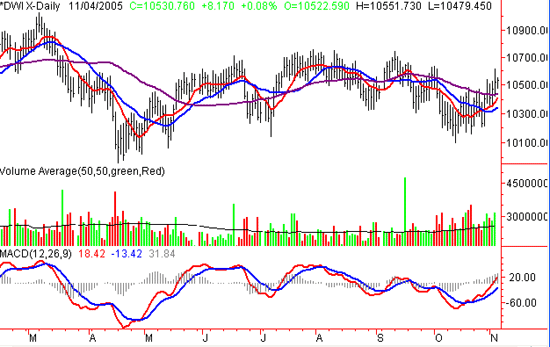
The Dow Jones Industrial Average closed at 10502, up 1.8% on average volume. There's really not much unique about the way the Dow moved this week. As expected, the index trailed the S&P and the NASDAQ the whole week. One key top that the Dow failed to overcome and will remain as a landmark is the 11,000 mark. That may seem far off, but it could very well be hit this coming week.
In conclusion, we remain bullish in the short term mostly due to our sentiment indicators including the major move in the NASDAQ this week.
DOW JONES INDUSTRIAL AVERAGE CHART - DAILY

Price Headley is the founder and chief analyst of BigTrends.com.