| Corcoran Technical Trading Patterns For March 23 |
| By Clive Corcoran |
Published
03/23/2010
|
Stocks
|
Unrated
|
|
|
|
Corcoran Technical Trading Patterns For March 23
There is a simple theme to today’s newsletter with little commentary.
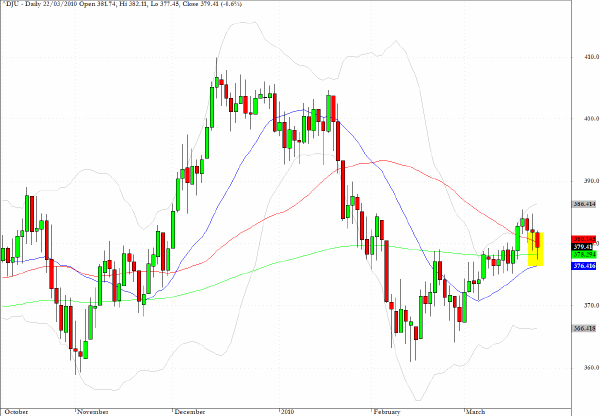
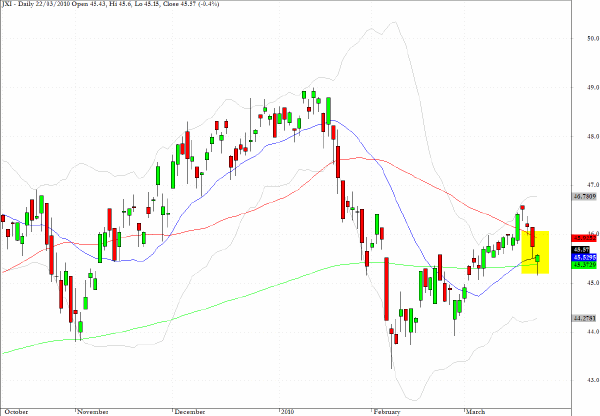
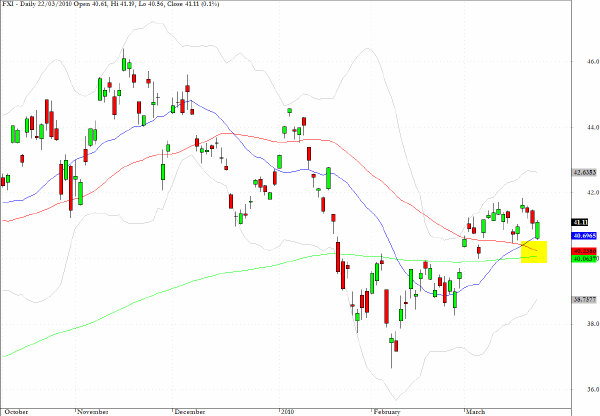
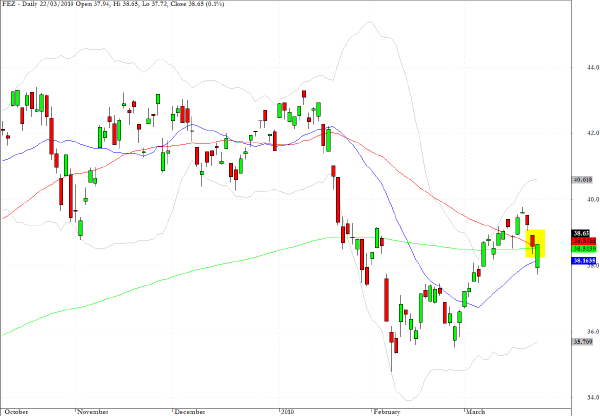
I have screened index and sector charts for those where the 50-day EMA is either at, approaching, or has just broken below the 200-day EMA. One further condition was that the so called "Golden Cross" in the other direction had to have taken place before the commencement of this year.
There are several that met the conditions and I have included some of the most notable in the charts which follow.
The first is for the Dow Jones Utilities Average.
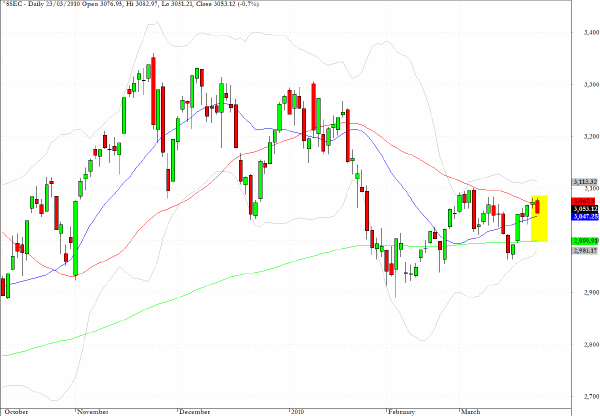
The second chart following today’s theme is for the Shanghai Exchange, which concluded Tuesday’s session with a 0.7% fall. Note that the 200 day EMA sits at almost exactly 3000.
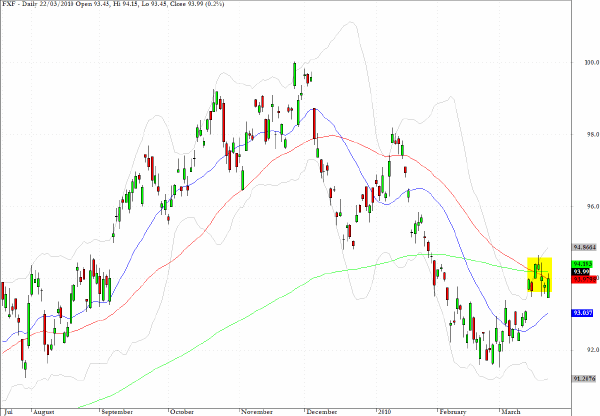
The Swiss Franc fell, as represented in the exchange traded fund, FXF, has recently seen the 50-day EMA drop below the 200 day EMA. In the FX market yesterday the EUR/CHF cross rate reached an historic lowest level as the Swiss currency continues to strengthen relative to the wilting euro.
The following news story reflects the concerns that this is causing for the Swiss government
The Swiss National Bank will not tolerate "an excessive appreciation" of the Swiss franc versus the euro and will take the necessary measures, SNB President Phillip Hildebrand said Tuesday.
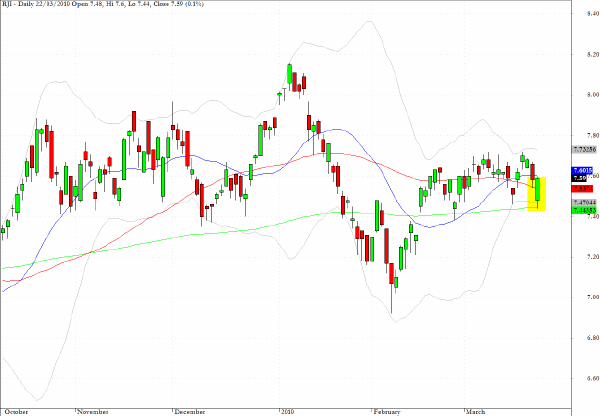
Commodities are fading as is evidenced by the chart for RJI, which is an exchange traded fund which emulates the Rogers Commodity Index.
In line with the first chart above, the sector fund which tracks global utilities, JXI, is on the verge of the crossover.
The sector fund, FXI, which tracks 25 major Chinese companies is performing in line with the Shanghai index.
The final chart for this column is perhaps the most surprising. FEZ tracks the EuroStoxx 50 and as can be seen the crossover happened in yesterday’s session.
Clive Corcoran is the publisher of TradeWithForm.com, which provides daily analysis and commentary on the US stock market.
|