| Corcoran Technical Trading Patterns For March 29 |
| By Clive Corcoran |
Published
03/29/2010
|
Stocks
|
Unrated
|
|
|
|
Corcoran Technical Trading Patterns For March 29
In European trading on Monday both sterling and the euro are seeing a bounce from the depressed levels seen last week. There appears to be relief in the market that Greece’s debt problems have been addressed by the EU fudge and there has been a slightly more positive tone to some recent UK data, perhaps the most "upbeat" of which is the fact that the public sector net cash requirement (as forecast in last week’s budget) for the current year has been decreased by £10 bn from the previously anticipated £178 bn. From this some commentators are predicting a much less severe path to recovery than previously thought. I need to get a pair of their rose colored spectacles for myself.
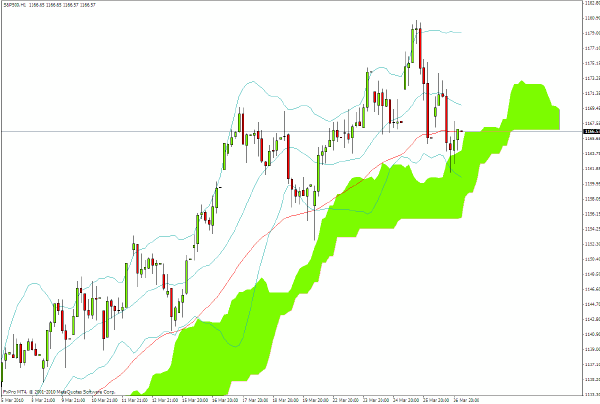
The hourly chart for the S&P 500 below shows the setback seen at the end of last week as the index met rejection at the 1180 level. Notice how the base of the cloud has provided support several times over the period shown, and while the short-term view is for more of the same i.e. a slow melt up into higher prices, a decisive violation of the support level provided could re-energize the bears. In turn, their subsequent short covering would provide the fuel for the next leg up.
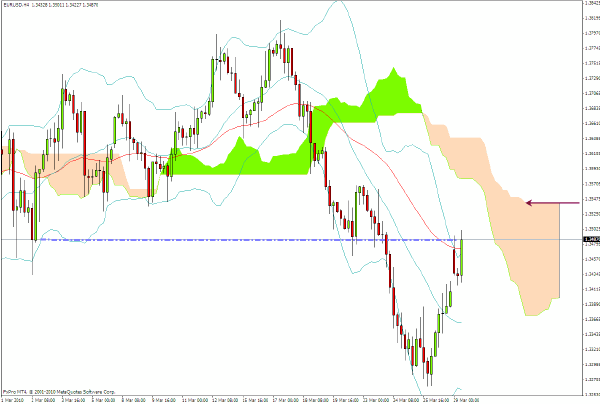
After breaking down into the $1.32’s last week EUR/USD is now trying to re-establish a foothold above the pivotal $1.35 level. As can be seen on the 240-minute chart, the current level is an area of previous support/resistance and the cloud formation ahead should stall much further progress and lead to a near term price congestion zone.
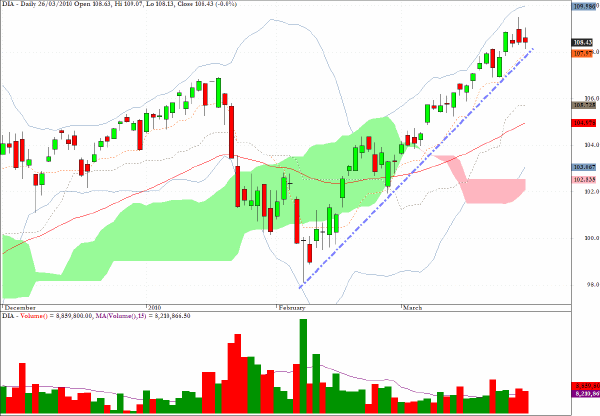
The chart below illustrates the remarkably steep and uniform trend line drawn for the recovery since early February on the proxy for the Dow Jones Industrials, DIA. Also notice the persistently low volume since the tide turned in early February
Markets rarely trade in such a predictable manner and I would suggest that the large presence of algorithmic trading routines is surely part of the reason for this new "normal" in price development. The task for the technical analyst is to sharpen and modify the tools available, as well as presenting new ones, to keep an edge in understanding where the opportunities lie other than simply being a blind follower of the current bias of the automated programs.
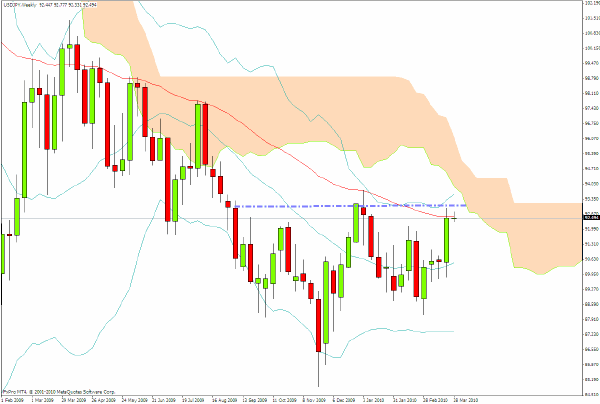
In my estimation, USD/JPY is setting up for a substantial breakout if it can clear the 93 level. The long-term weekly chart shows that a break through the resistance indicated and then a piercing of the cloud formation, which is not too "thick", would put targets of 97 and then up towards 100 in the frame during the coming months.
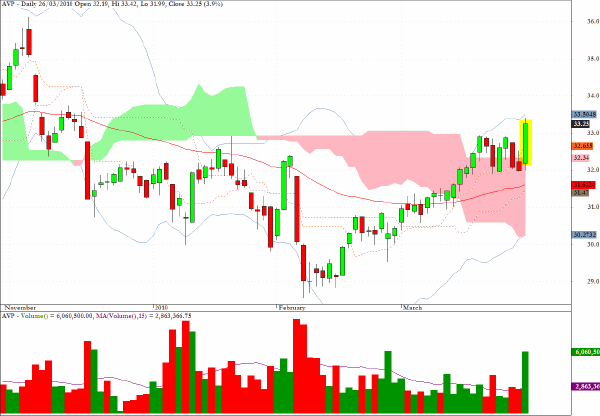
Avon Products (AVP) looks capable of heading back to the $36 level seen last in November 2009.
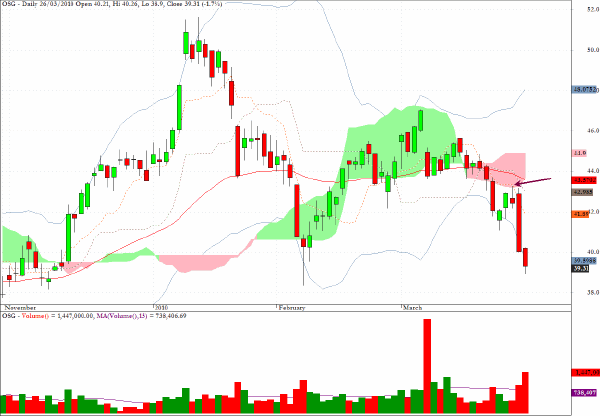
In last Monday’s commentary I suggested that Overseas Shipholding (OSG) looked vulnerable and that I would be stalking a short position on any rebound. Uncannily that opportunity was provided at the failure to break above the overhead cloud formation (illustrated by the arrow) and the selloff produced a nicely profitable trade which has now been exited.
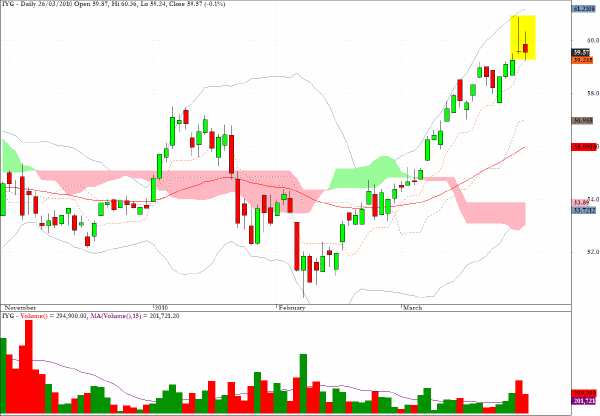
IYG registered a noteworthy gravestone doji formation last Thursday on twice the average daily volume. This pattern is not seen too often, but, given my comments earlier about the manner in which the micro-structure of markets is changing with the continuing adoption of automated trading strategies, one has to proceed with caution in using some previously reliable set-ups based principally on candlestick analysis.
The fund looks over-extended to my eyes and there could be a correction down to the $54 level in the intermediate term, but at present institutions and fund managers seem to be erring on a belief, abetted by the algorithmic practitioners, that the financials have nowhere to go but upwards.
Clive Corcoran is the publisher of TradeWithForm.com, which provides daily analysis and commentary on the US stock market.
|