| Corcoran Technical Trading Patterns For March 31 |
| By Clive Corcoran |
Published
03/31/2010
|
Stocks
|
Unrated
|
|
|
|
Corcoran Technical Trading Patterns For March 31
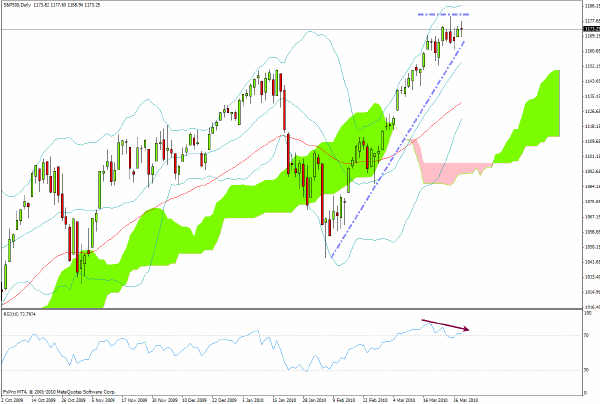
I commented earlier this week on the very steep ascent of the proxy fund for the Dow Jones Industrials, DIA, and thought it would be worthwhile to show the same configuration for the S&P 500 cash index.
The 1175-80 zone appears to be presenting a formidable overhead hurdle and meanwhile the RSI chart segment below is showing that there is a stalling out of the upward momentum/relative strength.
The next few trading days could well be erratic as today marks the end of the first quarter, tomorrow sees the NFP data and Friday is a holiday throughout Europe and for most American markets (also Monday is a holiday in the UK and parts of Europe as well). I shall be looking to be flat ahead of the data tomorrow and would not be looking to carry any positions over the extended weekend.
In European trading, sterling was energized earlier this morning - for no apparent reason - or at least none that caught my attention - and this had the effect of causing abrupt movements in EUR/GBP in particular. I am hesitant to embrace the notion of sterling strength at present although I was well positioned on the long side of GBP/JPY - more of which below.
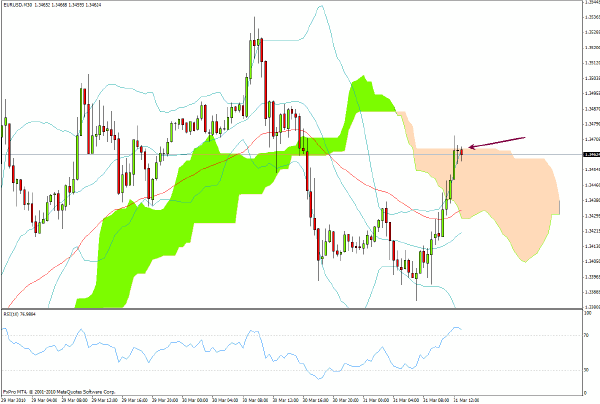
The 30-minute chart for EUR/USD shows that the $1.3470 level - at the top of the Ichimoku cloud - is acting as a brake on further progress at present but on the longer time frames a move up to the $1.3540 level seems attainable in coming sessions.
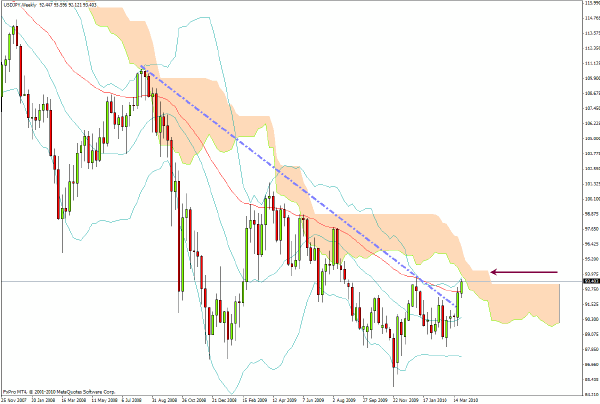
USD/JPY is by far the most interesting chart of the day and the dollar has now moved decisively above 93.20. As I have been commenting for some time, the next hurdle is the point indicated by the arrow on the chart and a move above this - which I believe is now on the horizon - would be a game changer for this cross rate.
It would also have wider implications for global asset allocators, and would, in accordance with commentary here previously regarding the tendency for the yen to show co-movement with the US Treasury complex, be an inter-market indicator that yields on the long end of the Treasury spectrum are destined to move higher.
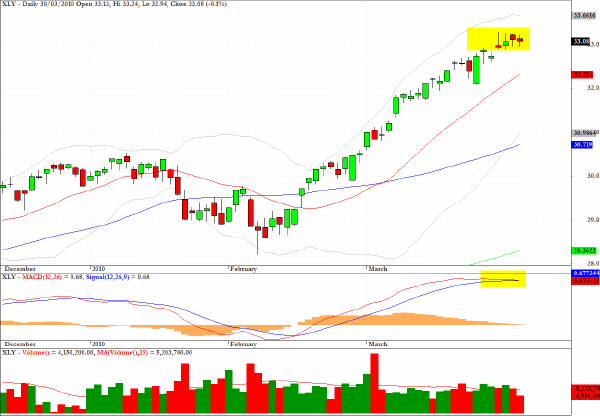
XLY, the exchange traded fund for the consumer discretionary sector, may be able to retain its poise in line with the end of quarter portfolio cosmetics, but the sector looks over-extended.
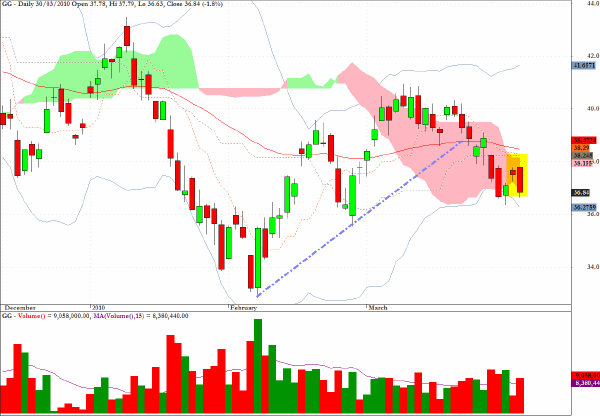
The daily chart for Goldcorp (GG) shows that the break below the cloud formation, coupled with the earlier break of the trendline drawn, suggests that this stock could revisit the February low in the intermediate term.
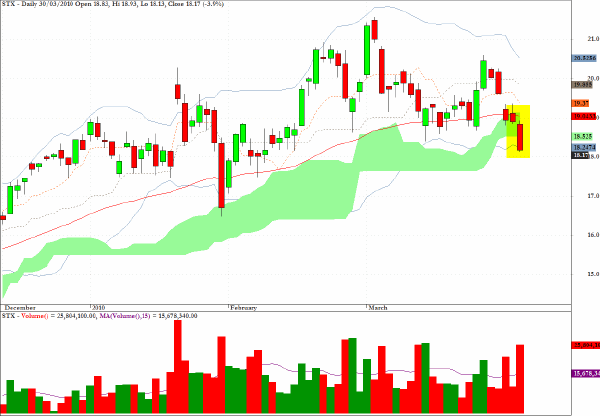
Seagate Technology (STX) has a bearish looking pattern from an Ichimoku and volume perspective.
Clive Corcoran is the publisher of TradeWithForm.com, which provides daily analysis and commentary on the US stock market.
|