| Corcoran Technical Trading Patterns For April 8 |
| By Clive Corcoran |
Published
04/8/2010
|
Stocks
|
Unrated
|
|
|
|
Corcoran Technical Trading Patterns For April 8
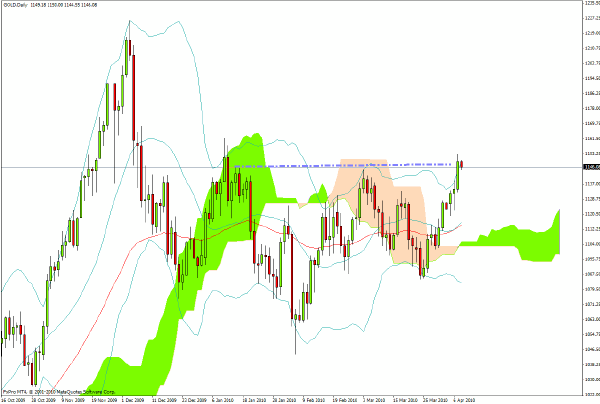
Scanning the daily charts this morning it is not obviously apparent that yesterday's North American session actually saw evidence of a re-emergence of risk aversion. Ongoing anxieties about Greece's public finances, as well as increasing evidence of capital flight from the nation's banking system helped to bring the spread between bund yields and Greek governments to more than 400 basis points - a historic high - and this kept the euro under pressure all day. Also there was tension about the auction of US Treasuries and some relief late in the session that it was not as troublesome as some had feared. Perhaps the most intriguing chart for the day was for spot gold. A couple of weeks ago I pointed to the critical testing of the $1085 level which the metal managed successfully and since then the metal has now moved back towards an equally challenging test of the $1150 level. I would not play the breakout until it is validated i.e. a successful daily close above $1155, but the chart looks constructive again for the longer term targets which I have discussed earlier this year in the region of $1350, and quite possibly beyond.
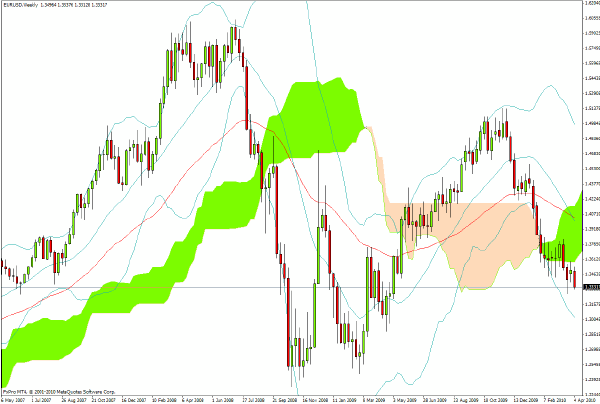
EUR/USD seems destined to test the 1.3280 level in the coming sessions and the intuition is that a lot of traders will be looking to cover as the EZ currency approaches this level. Sentiment regarding the euro is distinctly bearish and there could well be a spike upwards as the shorts scramble to cover. Looking at the longer term weekly chart I would simply repeat my observation that the decisive break down below the green cloud suggests that there is a relatively low probability of the currency pair breaking back above the $1.37 level any time soon. Since starting to write this letter the euro is now heading down for the crucial test and by the time this is read the situation will be a lot clearer.
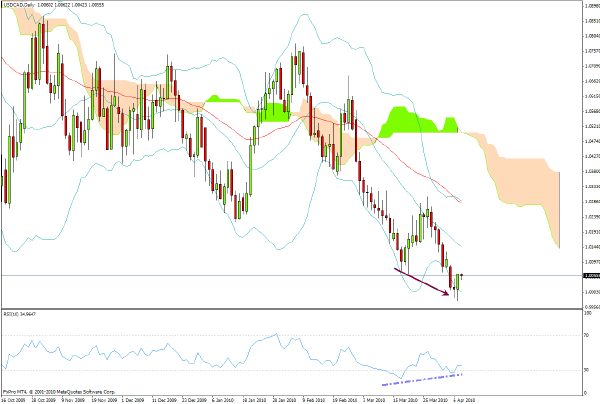
After hitting parity in the last few sessions, there is evidence of some positive divergences arising on the USD/CAD chart and I would favor the long side i.e. a US dollar rebound, as a short term tactical play.
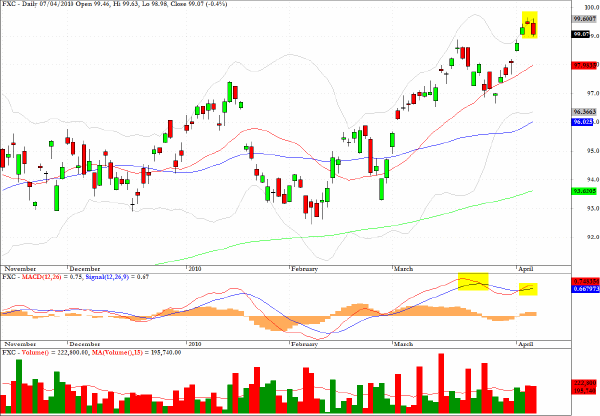
For those without direct access to the spot FX market, or who prefer to use exchange traded funds, the chart for FXC shows from an inverse perspective the vulnerability of the Canadian dollar in the near term and a short position is worthy of consideration.
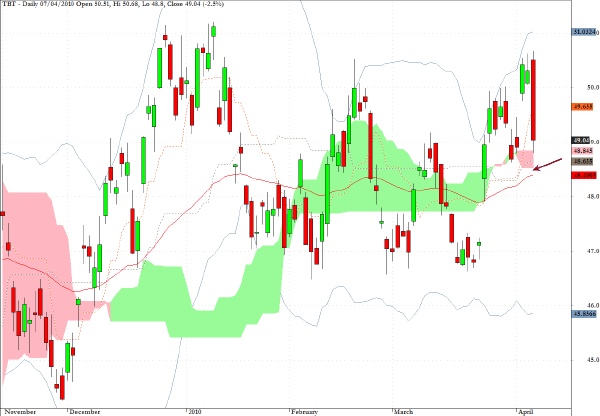
TBT, a vehicle which moves up in line with upward movement in long term Treasury yields - will be on my watch list today if it reaches down to the arrow marked on the chart.
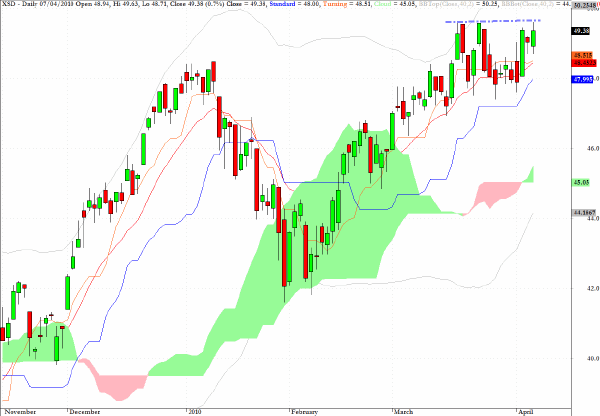
From a bullish perspective, the chart for XSD suggests that an upward breakout could be imminent.
Clive Corcoran is the publisher of TradeWithForm.com, which provides daily analysis and commentary on the US stock market.
|