| Corcoran Technical Trading Patterns For April 16 |
| By Clive Corcoran |
Published
04/16/2010
|
Stocks
|
Unrated
|
|
|
|
Corcoran Technical Trading Patterns For April 16
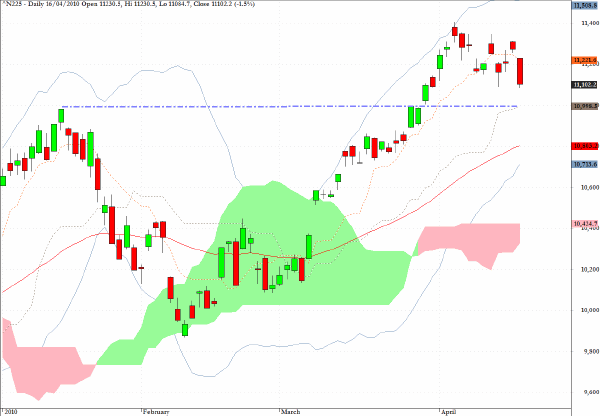
While the S&P 500 seems no longer to have a reverse gear, Asian markets fell back in trading on Friday as concerns are mounting about the growing threat of inflation (mainly in higher commodity prices) and signs of speculative excesses developing in Chindia. Somewhat overlooked in the last 24 hours was the decision by the Singaporean government to revalue its dollar against the USD as a way of resisting imported inflation – a trend which I suspect will spread for emerging Asian currencies (but not the yen as discussed below). The Nikkei 225 has chart support at 11,000 and should be watched next week as it approaches this level, as a failure to hold at this level would violate a clear uptrend line since the February low.
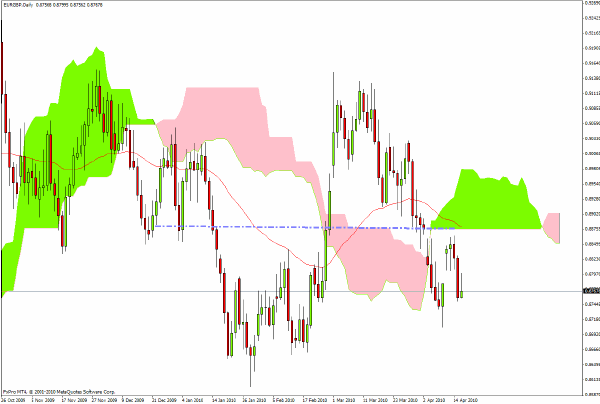
Day trading in spot foreign exchange markets is not for everyone, but there are some great profit opportunities with spread trading around a specific cross rate. EUR/GBP has now broken below key support and it allows traders to scalp two legs of the implied trade EUR/USD and GBP/USD with a lot of flexibility for position adjustment and management while monitoring the underlying relationship between the euro and sterling. For now there seems to be a bullish bias for sterling against the troubled EZ currency but caution is advised as we move into the latter part of April and closer to the UK election as the pre-election spin may keep the electorate off balance but the sad state of the country's public finances is unlikely to appear any more appealing to large global asset allocators, including PIMCO, any time soon.
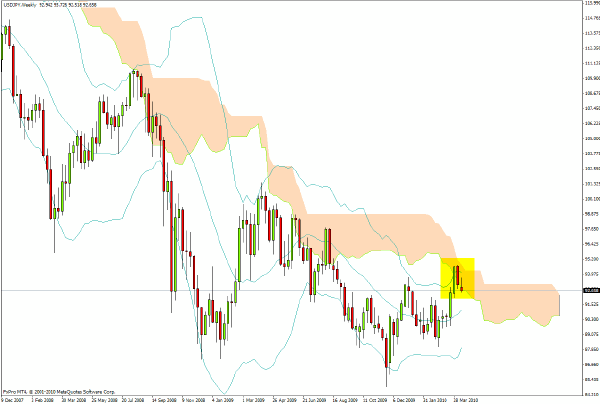
USD/JPY is one currency pair which requires a lot of patience for day traders - unlike GBP/USD which can’t sit still. As I have said on numerous occasions the dollar has almost certainly seen a basing against the yen and a break above 94.50 - the weekly cloud top - would turn me decidedly bearish on the Japanese currency against the dollar.
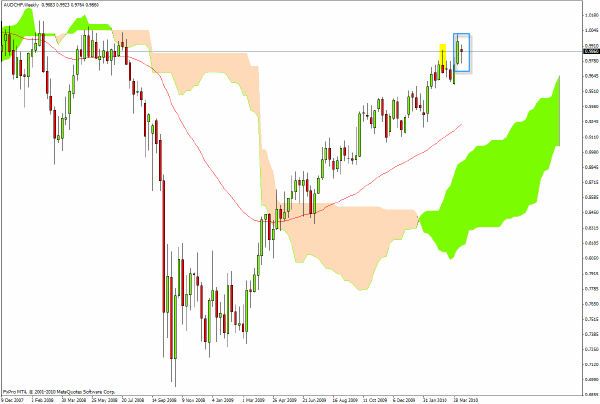
From a longer-term macro perspective I do believe that there is too much risk appetite at present and one of the gauges of that is AUD/CHF which is now very close to where it was before the July 2007 meltdown in the FX carry trade began. Recent candlestick formations on the weekly chart are, I believe, alerting an imminent inflection point on this cross rate.
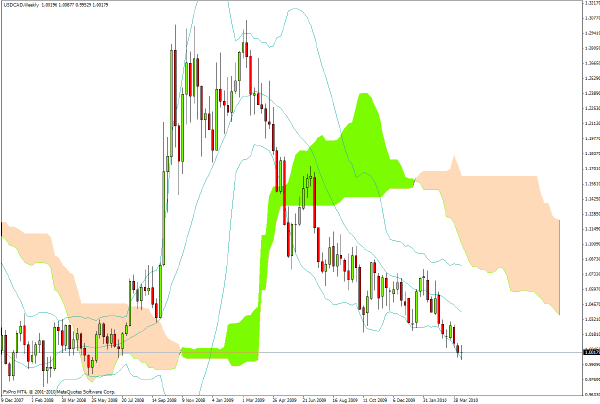
This may be a strongly counter-intuitive suggestion (I have been early and wrong on big moves previously), but USD/CAD, after hitting parity very recently, seems now to be ready for a tradable correction.
The remarkable downtrend since early 2009 has been almost without interruption and this may well attract contrarian traders who will want to test some large FX position traders who have grown complacently short the US currency against the Canadian dollar.
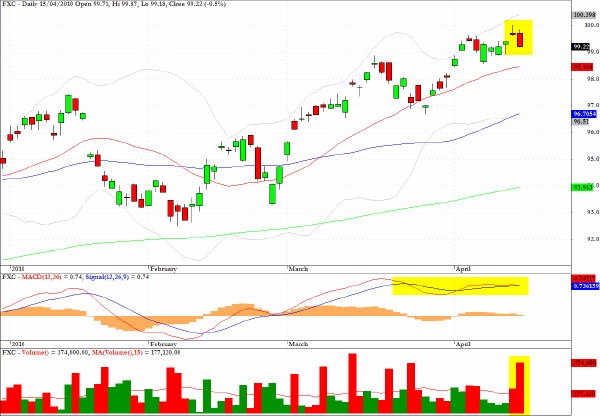
FXC, which represents the inverse pattern to USD/CAD (i.e. it is a long perspective on the Canadian dollar) is revealing more evidence that supports the fact that negative MACD divergences are attracting some short sellers.
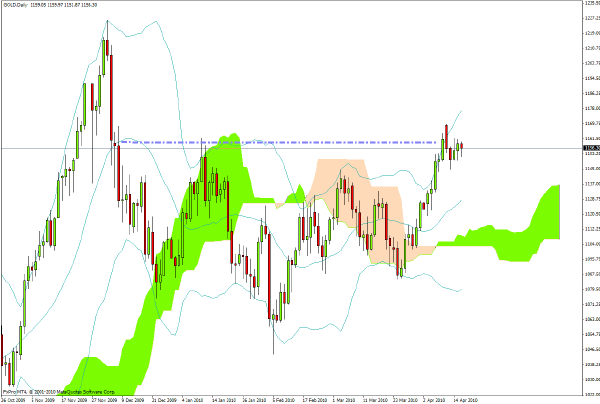
As the price development pattern for spot gold evolves I am still of the view that a sudden breakout could be the catalyst for rapid price escalation.
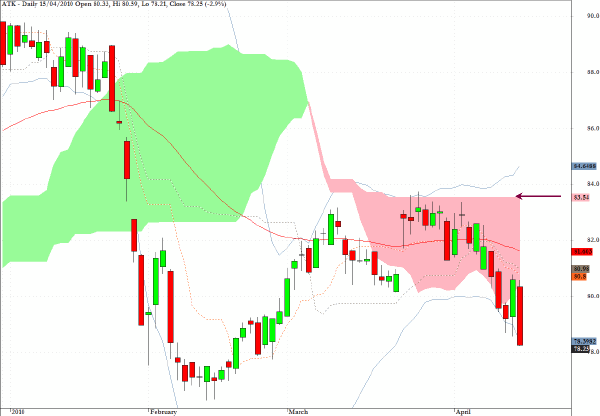
Some time ago I mentioned that Alliant Tech Systems (ATK) looked vulnerable after registering a gravestone doji candlestick and confronting a very strong resistance level at the top of the cloud pattern, which has been marked on the chart. The stock is now fulfilling the expected weakness but I would be retiring existing positions rather than establishing new ones.
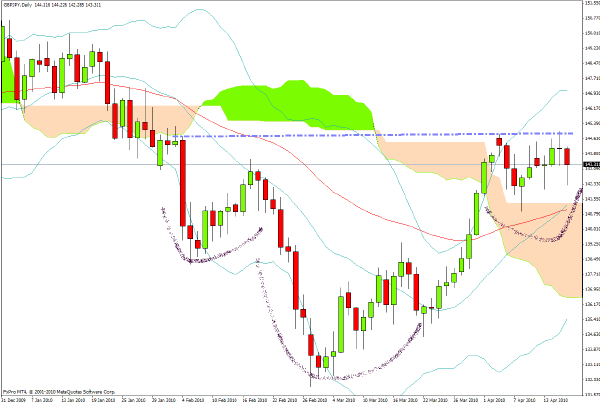
The final pattern for today's column which has caught my attention is a slightly convoluted inverse head and shoulders pattern for GBP/JPY. A break above the dotted line indicated on the chart would, I suggest, lead to a strong upward move - and is in harmony with my overall bearish view on the yen.
Clive Corcoran is the publisher of TradeWithForm.com, which provides daily analysis and commentary on the US stock market.
|