| Corcoran Technical Trading Patterns For April 19 |
| By Clive Corcoran |
Published
04/19/2010
|
Stocks
|
Unrated
|
|
|
|
Corcoran Technical Trading Patterns For April 19
Asian markets, in addition to poor action last Friday before the Goldman news had broken, suffered further serious losses in trading on Monday.
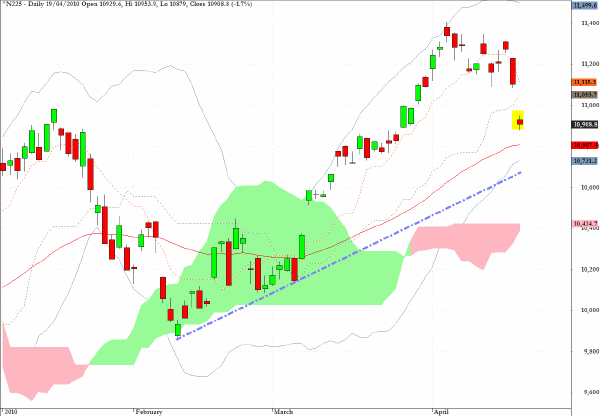
The Nikkei 225 dropped, with a large opening gap, below the 11,000 level which I discussed in Friday’s column and now faces a critical test of two levels indicated on the chart. The first is around 10,700 (dotted line) but with a reasonable likelihood that the 10,400 level - at the top of the cloud - will need to be tested.
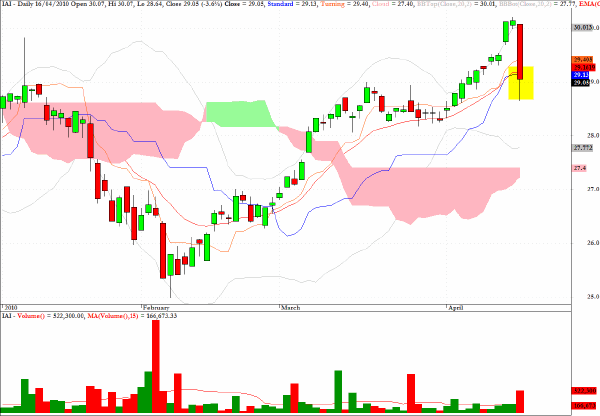
One of the better charts that shows the damage done by the SEC’s charges against Goldman Sachs is the one below for the exchange traded fund, IAI, which tracks the broker/dealers and investment banking sector.
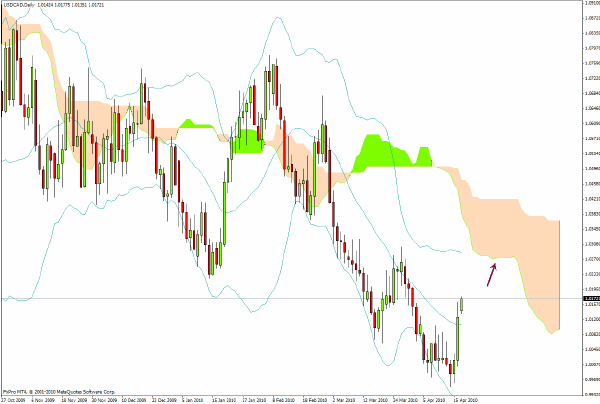
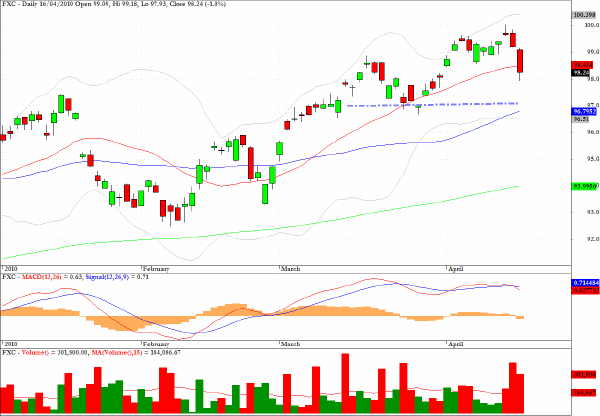
Among last week’s suggestions in this column, most of which turned out to have been on the right side of the respective trades, the call on impending Canadian dollar weakness (which was one of the least obvious) has produced lavish profits since first discussed.
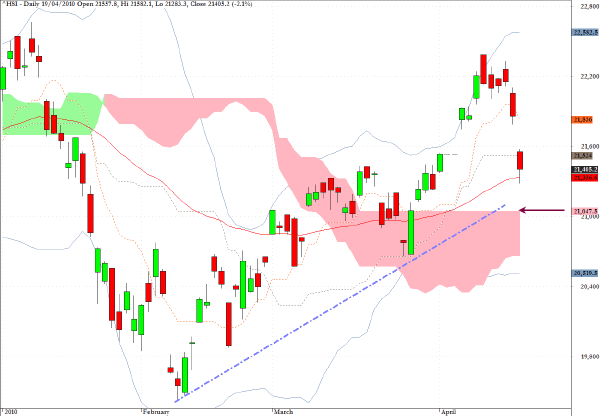
One of the calls last week was to short EWH, which acts as a tracker of the Hong Kong market, and this will surely be down even further when North American trading begins this afternoon, even after Friday’s fall, as the Hang Seng Index (HSI) fell back by more than 2% in Asian trading on Monday.
As indicated on the chart for the Hang Seng, there is a firm layer of support just above the 21000 level, but if this fails to provide a safety net then a sustained fall would clearly violate the uptrend line in evidence since the early February low.
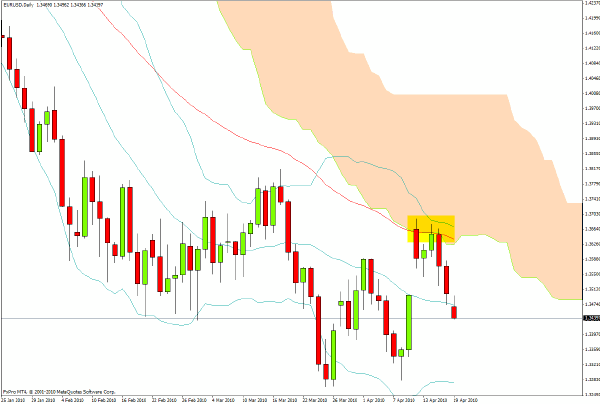
EUR/USD seems destined to test the $1.3270 area again in coming sessions and the lack of obvious support and the growing awareness of the weakness of the EMU political/financial architecture is pointing to a potential for a failure on the re-test and a retreat into the $1.20’s.
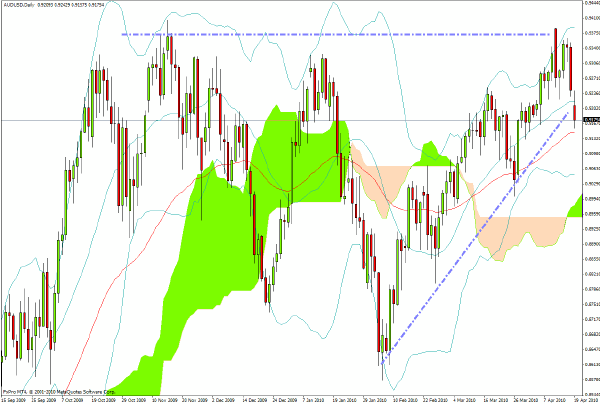
AUD/USD is another currency pair which may suffer as the RISK ON orientation lately is superseded by a more cautious tone. Also to be factored is the recognition that much of the speculation in commodities and carry trade is conducted by the main Wall Street prop trading desks, which may be deciding that a lower profile with slightly less egregious bonuses is a smart move in the current climate.
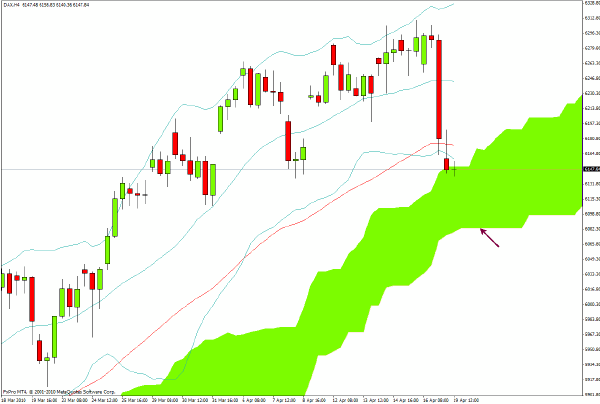
The 240-minute chart for Germany’s DAX showing Monday’s early sell-off has found support at the top of the cloud formation, but it is likely that the base of this cloud will be tested today and if that fails to provide support the daily chart indicates technical support in the 6000 area.
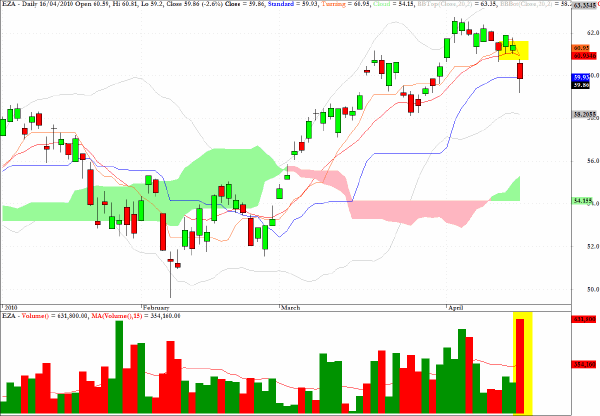
Also discussed here last week are the growing negative divergences for EZA which tracks South African equities.
If you had acted on this suggestion, I would continue to hold short positions in the coming sessions with a focus on scaling out as the $58 level is approached.
My target of 97 on the chart for FXC - made here early last week - still holds as the Canadian dollar is showing considerable weakness in European trading on Monday morning.
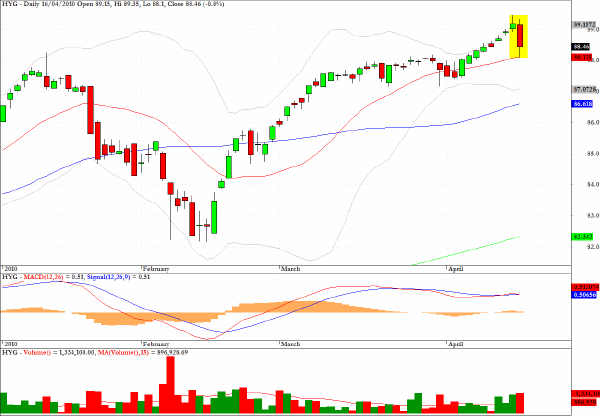
The chart for HYG, which provides exposure to the high yield sector, and also suggested as a short candidate here last week, reveals the fact that while the safe haven provided by investment grade and Treasuries saw an uptick on most fixed income sector ETF’s, many players decided to take some money out of the more high risk credits.
Furthermore it may well reflect a lightening up of some large and leveraged positions being held by investment banks and hedge funds that have been wallowing in profits from this sector in recent months.
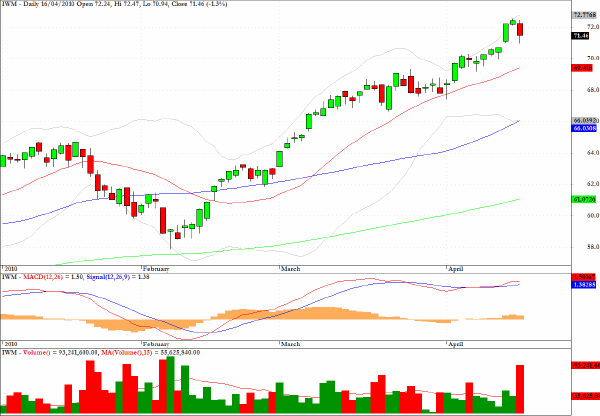
IWM is the exchange traded proxy for the Russell 2000 and a spread of long DIA and short IWM would be worth considering as the Risk On dynamics fade.
Clive Corcoran is the publisher of TradeWithForm.com, which provides daily analysis and commentary on the US stock market.
|