The S&P 500 registered an inside session in trading on Monday and the pattern suggests that there is a probability that there could be further testing of the downside in coming sessions, and the 1170 area is a plausible target for the bears to want to test.
There is a fair amount of anxious trading on Tuesday morning as European traders - many of whom were on holiday yesterday - are not expressing a great deal of confidence in the proposed "solution" to the Greek sovereign debt crisis. By some estimates the EU/IMF rescue package could be about 50 billion euros short, given the depth of the black hole in that country’s public finances - and that is without considering contagion issues related to Spain and Portugal etc.
The S&P 500 registered an inside session in trading on Monday in the US and the pattern suggests to me that there is a probability that there could be further testing of the downside in coming sessions - and the 1170 area indicated on the chart is a plausible target for the bears to want to test. 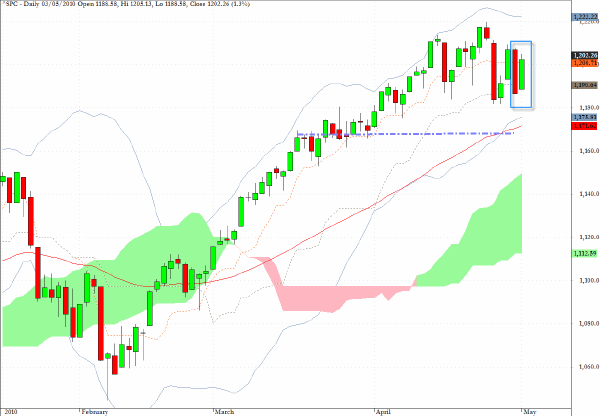
The Shanghai exchange fell once again in trading on Tuesday in Asia.
As shown on the left hand side of the chart the targets from last fall would seem to require testing. 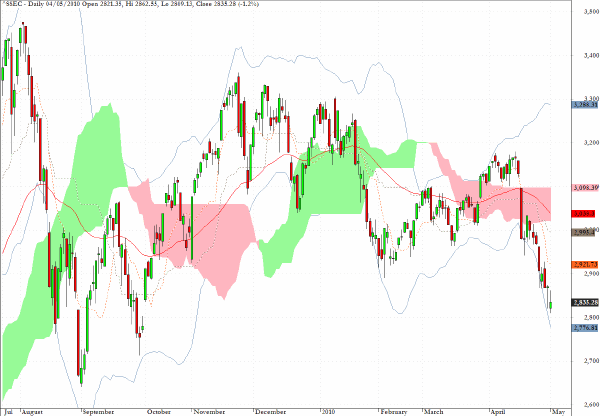
USD/JPY has now emerged from the weekly cloud formation as anticipated here over the last several weeks.
The yen touched 95 in the last 24 hours but has retreated back in to the mid 94’s.
It will be interesting to see whether, with risk off dynamics back at work, the previously observed link in flight to safety behavior, with consequent benefits to the Japanese currency, has now been broken.
I suspect it has. 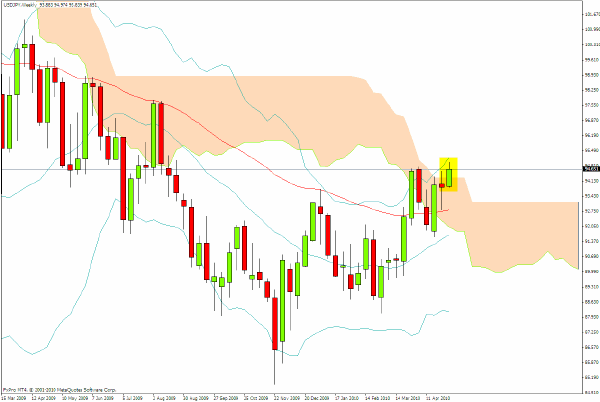
The Australian central bank raised short-term rates again today but indicated that it may now take a pause.
The break in the trendline on $AUDUSD suggests that a target at the base of the cloud on the daily chart is now feasible. 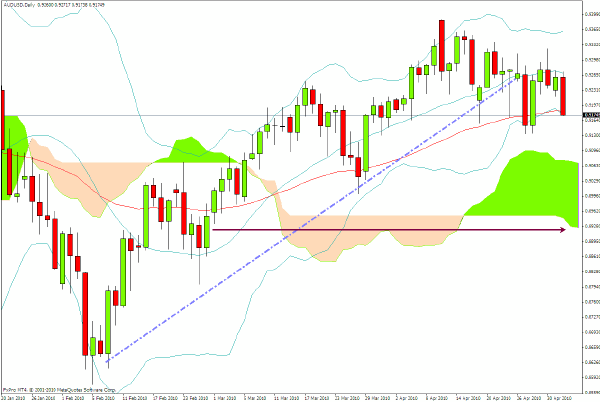
As indicated here last week the chart for spot gold was suggesting strongly that the metal was poised to move rather quickly upwards once it could break above $1170.
As I am writing this the metal has just touched $1189.36 and I would expect to see $1200 some time in the next few sessions. 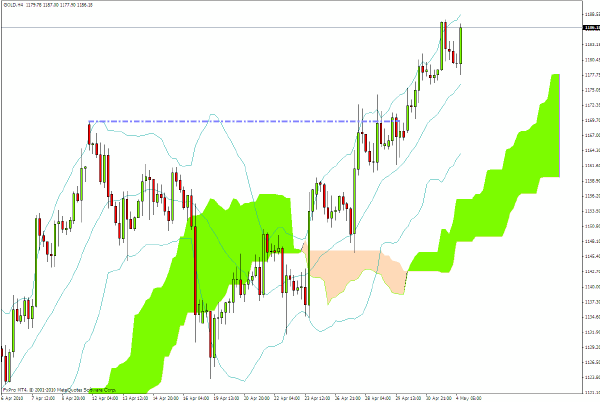
SLV, the exchange traded fund for silver, reveals a tiny doji star from trading yesterday.
For those with a bullish view of the secondary precious metal there is clearly a buy channel intact in the metal but the chart also shows that the metal needs to move decisively above the $19 level to avoid a triple top failure.
The gold/silver ratio suggests that silver should play catch up but if the movement in gold is based largely on a fear of the integrity of paper assets then the safe harbor play may not cross over to the junior precious metal with the same urgency in the near term. 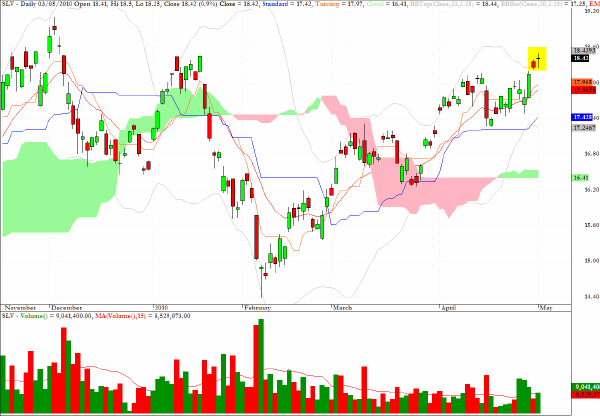
TLT, which tracks the prices of 20-year-plus US Treasuries, reveals a bullish ascending trend-line through recent lows and penetration of a major line of resistance.
This chart serves to illustrate one beneficiary of the RISK OFF sentiments which are manifesting themselves with respect to global asset allocation strategies. 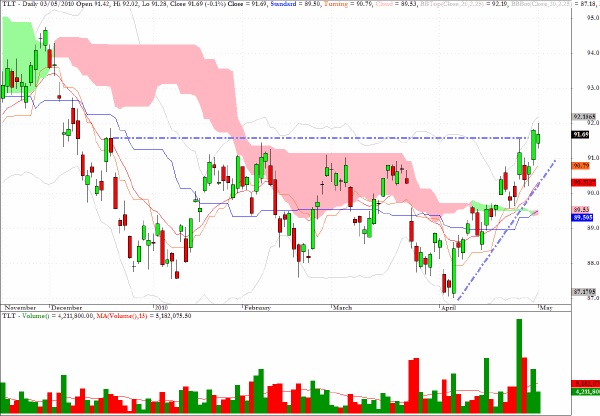
I commented on the Canadian dollar several times during April with a bearish orientation. The central bank of Canada intimated that it would be tightening interest rates which produced a knee-jerk upward surge in the loonie - as the Canuck buck is called - but the overall technical pattern was really pointing to weakness which is beginning to re-assert itself.
The 97 level would seem to be back in play. 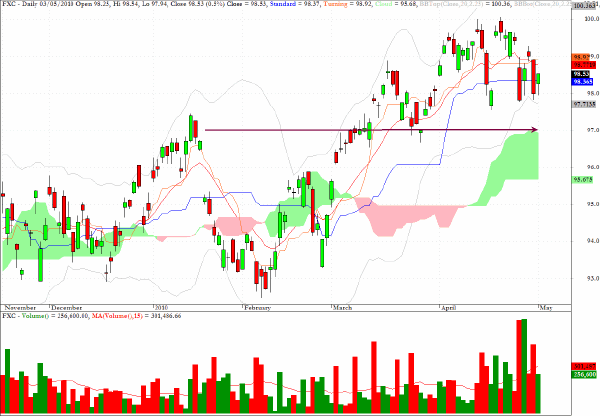
Clive Corcoran is the publisher of TradeWithForm.com, which provides daily analysis and commentary on the US stock market.