| Corcoran Technical Trading Patterns For May 5 |
| By Clive Corcoran |
Published
05/5/2010
|
Stocks
|
Unrated
|
|
|
|
Corcoran Technical Trading Patterns For May 5
This was one of my comments from yesterday’s Daily Form.
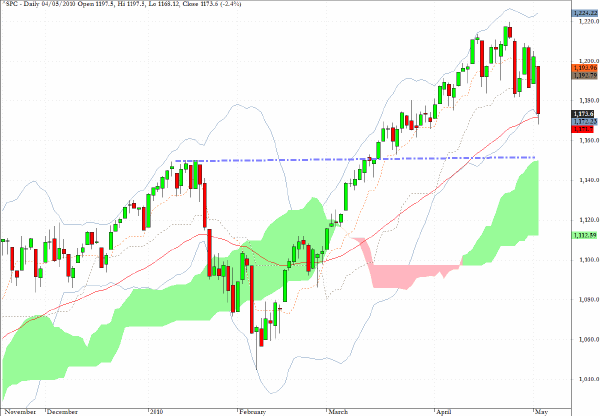
The pattern (on the S&P 500) suggests to me that there is a probability that there could be further testing of the downside in coming sessions - and the 1170 area...is a plausible target for the bears to want to test.
The bears certainly didn’t waste time and took advantage of the ugly performances of European bourses in Tuesday morning’s trading and started clobbering US equity indices as soon as New York opened for trading.
Yesterday’s intraday low was 1168 and the index managed to find some late support which enabled it to close at 1173.
As can be seen from the chart below there is a clear line of support/resistance plus the top of the cloud formation at 1150 and this would now seem to be in play. However the bi-polar nature of current sentiment (which is well reflected in today’s chart of the VIX) could also see a sharp rally before the market seeks out this 1150 level.
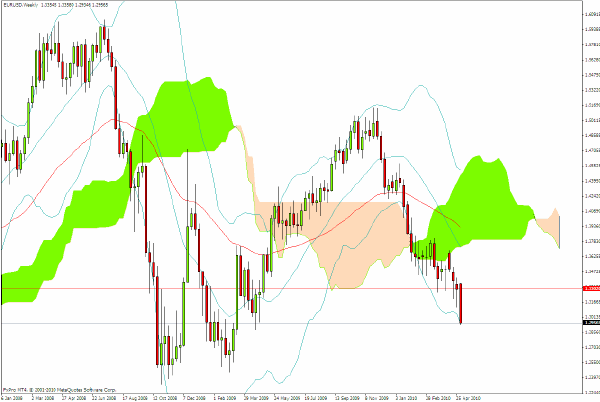
The major focus for markets near-term can be summed up in the fate of the weekly chart below which is for $EURUSD.
For some time I have been expressing the view that the EZ currency has a problematic and uncertain future and, without too much exaggeration, it is fair to say that the EMU could disintegrate. As such I have been expecting to see levels in EUR/USD in the $1.20’s, and eventually quite probably even lower levels.
At the time of writing, in European trading the current rate is $1.2960, and while I plan to step aside for today’s session, there are clear targets approaching $1.25 which will need to be visited in the coming weeks.
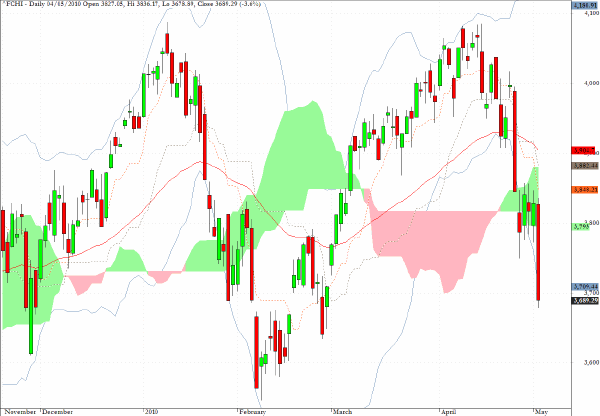
The CAC 40 was one of the weakest performers in yesterday’s drubbing throughout Europe and the chart below reveals a remarkably symmetrical pattern - an "M" shape which resembles the pattern seen on the monthly chart for the S&P from 2000 to 2008.
Targets below 3600 are now on the horizon - and if Greek private sector banks continue to experience massive capital flight and start to fail, the French banking sector, which holds a lot of their paper, will find itself even more on the back foot than most European banking sectors.
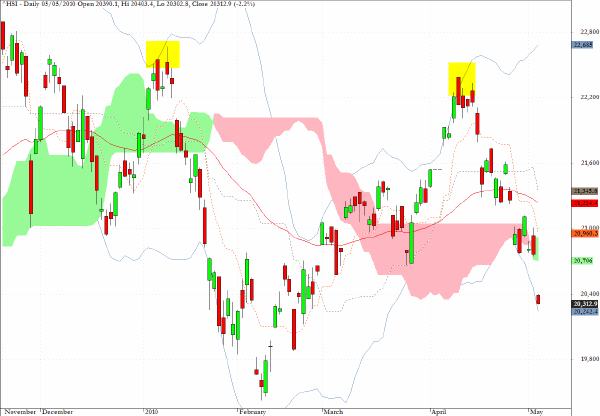
The Hang Seng Index has continued its plunge since the clear double top failure which occurred in early April, which is highlighted on the chart, and the February low of approximately 19,800 is a feasible intermediate term target.
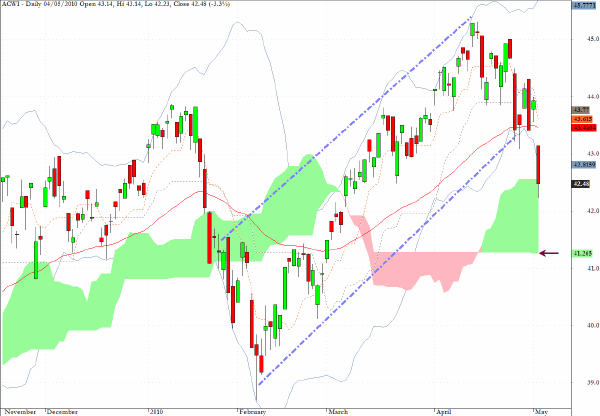
ACWI, is an exchange traded fund which tracks the MSCI All Country World index, and as the chart below indicates there is still some downside to be expected before the support level from the base of the cloud formation kicks in.
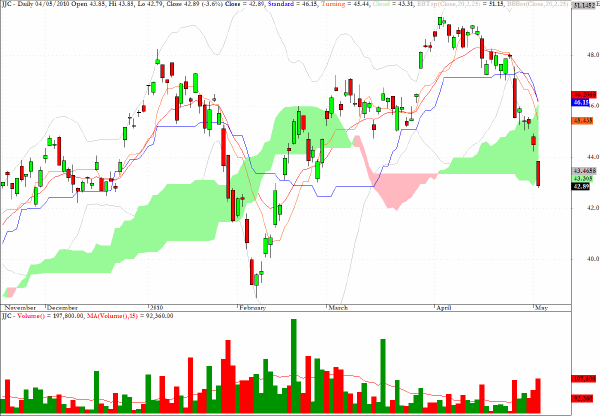
JJC, is a convenient ETF vehicle for traders who wish to express a view on the direction of copper. The fund is designed to reflect the performance on copper contracts. The index is composed of Copper High Grade futures contract traded on the New York Commodities Exchange.
As can be seen from the chart the selling has been rather abrupt in recent sessions and for intraday traders it would be worth looking at a short term tactical play of buying this fund for a short term bounce close to current levels.
A tight stop at $42 would be recommended and a reward/risk target should be set of twice the level of risk exposure from where one was to get filled.
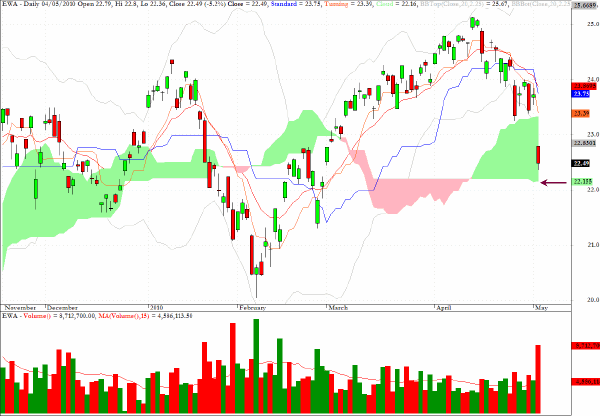
EWA, the sector fund for Australian equities, which I recommended as a short play last week has been very profitable so far but I will be looking to scale out of the remaining position today as the lower target from the cloud formation has more or less been satisfied.
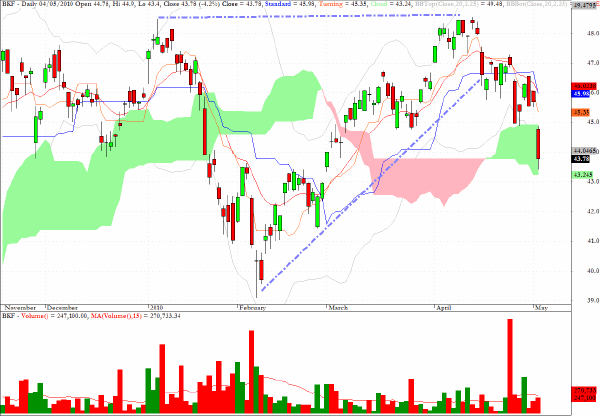
BKF, one of the main sector funds which track the BRIC economies, is clearly in the midst of a significant corrective phase but has reached a level where the short side is not presently appealing.
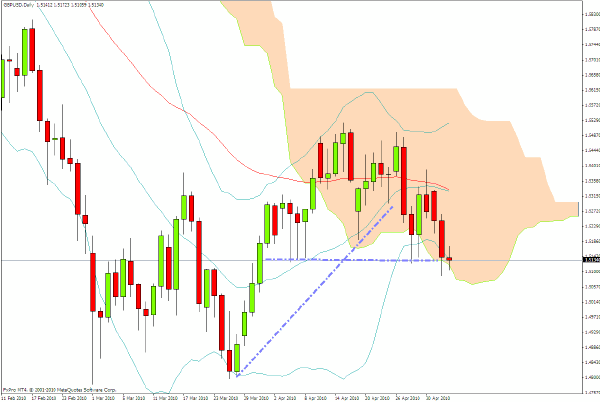
GBP/USD is at a critical chart level, in the neighborhood of $1.5130/50.
As can be seen on the chart there has been a clear violation of the short term uptrend line and on the daily Ichimoku chart the base of the cloud may help to provide near term support.
A break below $1.51 would put targets around $1.48 in play.
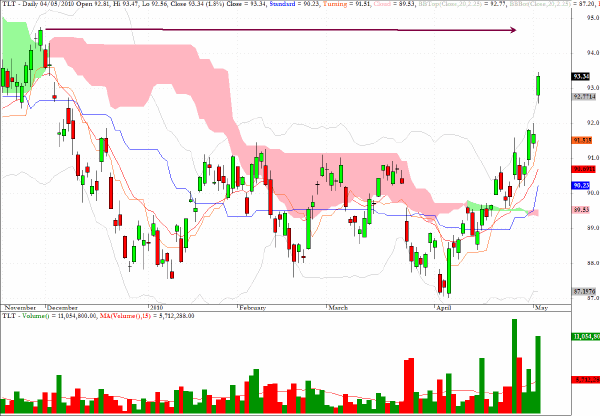
TLT, which tracks the prices of 20-year-plus US Treasuries, performed as expected in my comments yesterday. While the uncertainty about the "solvency" of key states in the EZ prevails (and those doubts will continue to come to the fore for some time to come) the safest harbor for global investors will be US Treasuries.
As I have said before, with some irony, in the fragile financial system which our financial/political leaders have allowed to develop, US dollar-denominated assets are the worst place to park your capital apart from all of the other places.
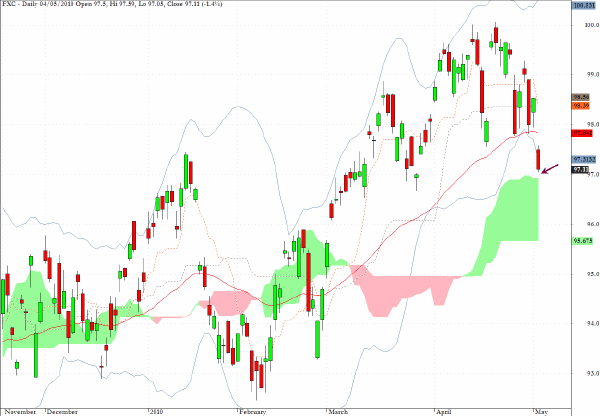
FXC came down almost exactly to my target level of 97 as cited here yesterday.
Clive Corcoran is the publisher of TradeWithForm.com, which provides daily analysis and commentary on the US stock market.
|