| Corcoran Technical Trading Patterns For May 6 |
| By Clive Corcoran |
Published
05/6/2010
|
Stocks
|
Unrated
|
|
|
|
Corcoran Technical Trading Patterns For May 6
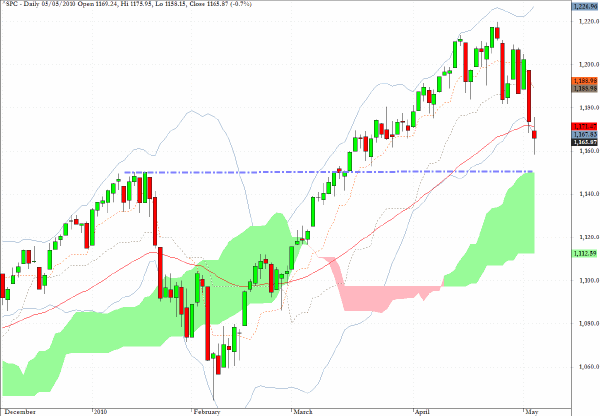
The 1150 level on the S&P 500 should prove a strong attractor in coming sessions, perhaps even today - and it is hard to contemplate that those of a bullish persuasion would be satisfied to begin another rally in this index, unless this level shows that it can stand robust testing.
Longer-term, the case for US equities is, I believe, supported by the woes in the European markets as the contagion effects - and the eventual repercussions for the private banking sector in Europe where much more bad news is to come - will almost certainly result in a greater reliance on US dollar-denominated assets for most global portfolio managers.
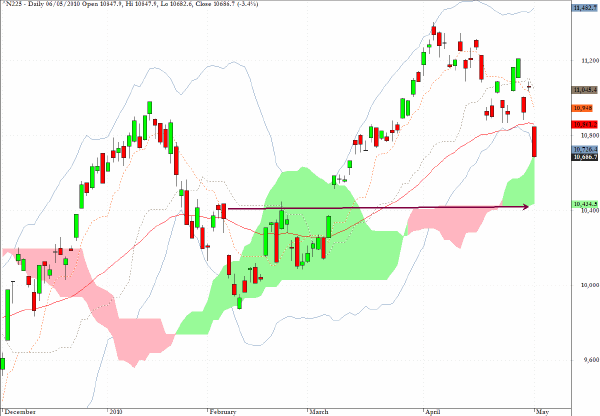
The Nikkei 225 in Tokyo re-opened for business today after holidays earlier in the week and had some catch-up to do. It dropped by 3.4% and I would suspect that 10,400 will need to be tested in the near term.
The CAC 40 continued to sell off more than many European markets yesterday as previously discussed. There is a chance that today’s session could see a bounce off the February low.

Several readers have asked for my comments on crude oil.
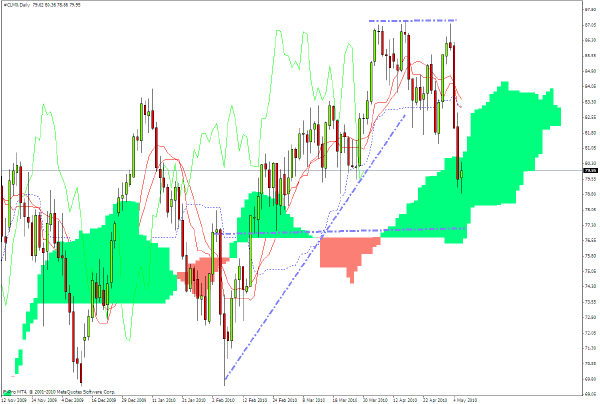
The chart below is for the June NYMEX contract for WTI and it shows that the price is currently within the cloud formation on the daily chart - which suggests that there is directional uncertainty until there is movement out of the cloud.
The fact that the up-trend line indicated has been clearly broken suggests to me that the base of the cloud around $76 per barrel will need to be tested, but this may be preceded by a test of the top of the cloud formation around $80.50. In other words I would prefer to step aside at this point. If $76 is broken on a closing basis then that would clearly bearish and put targets in the low 70’s in play.
Also, the strengthening US dollar - which shows no signs of abating - will tend to act as a drag on the price notwithstanding any other fundamentals related to the Gulf of Mexico oil spill for example.
Here again is my comment from yesterday on ACWI.
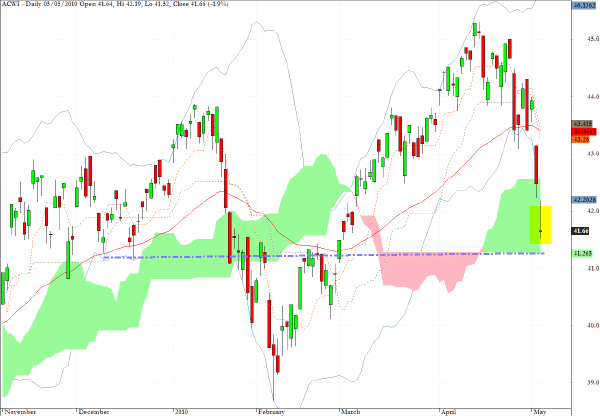
ACWI, is an exchange traded fund which tracks the MSCI All Country World index, and as the chart below indicates there is still some downside to be expected before the support level from the base of the cloud formation kicks in.
The long legged doji star suggests that caution is now advisable although the base of the cloud could well be tagged again in coming sessions.
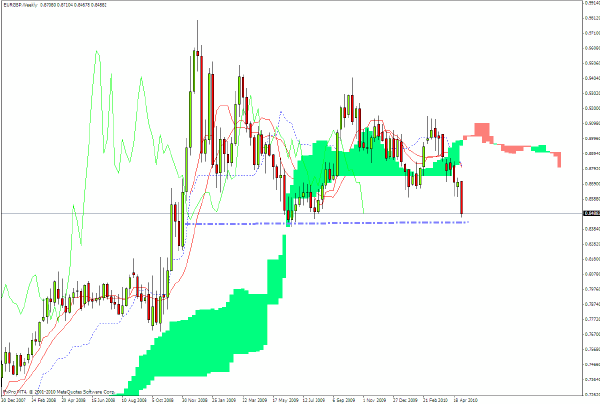
EUR/GBP is behaving quite erratically in trading in Europe on Thursday morning as the cross rate is moving down towards a test of the 0.84/5 area which - as can be seen on the chart - is a critical level.
With ongoing woes in the EZ and the UK election being held today - I am confining my trading to very short-term scalps on EUR/USD and GBP/USD but it is keeping me on my toes as there is a lot of whipsaw activity.
It will be better to review the two key European currencies early next week - when more of the dust (including even more volcanic ash!) has settled.
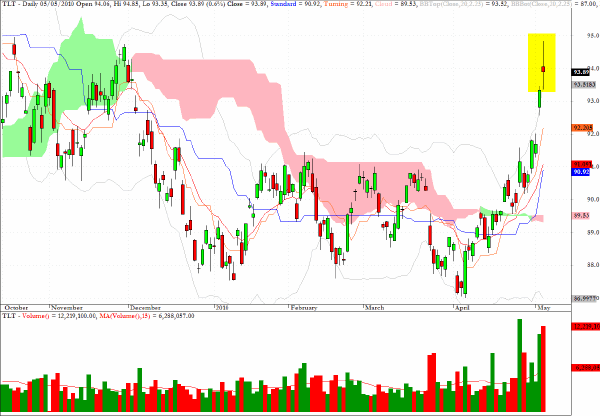
The chart for TLT, which tracks the prices of 20 year plus US Treasuries, resembles that for ACWI with another long legged doji and I would make a similar comment as before. I would expect the top of yesterday’s range to be tested again today but would not be looking to remain in the position overnight - especially as the NFP data will be released before the US markets open tomorrow.
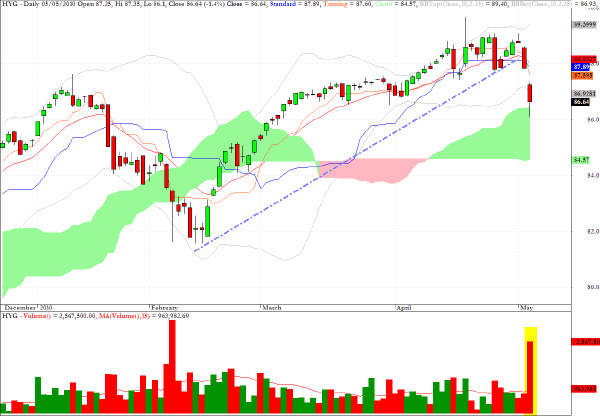
The chart for HYG, which provides exposure to the high yield sector, appears to be suffering as more portfolio managers may be realizing that insufficient returns have been available for a lot of relatively high risk credits - including sovereign debt for most of southern Europe.
Clive Corcoran is the publisher of TradeWithForm.com, which provides daily analysis and commentary on the US stock market.
|