| Corcoran Technical Trading Patterns For May 7 |
| By Clive Corcoran |
Published
05/7/2010
|
Stocks
|
Unrated
|
|
|
|
Corcoran Technical Trading Patterns For May 7
The first two charts for today’s commentary need to be considered together.
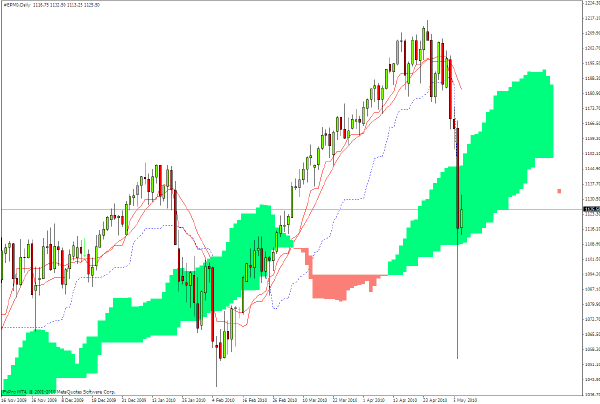
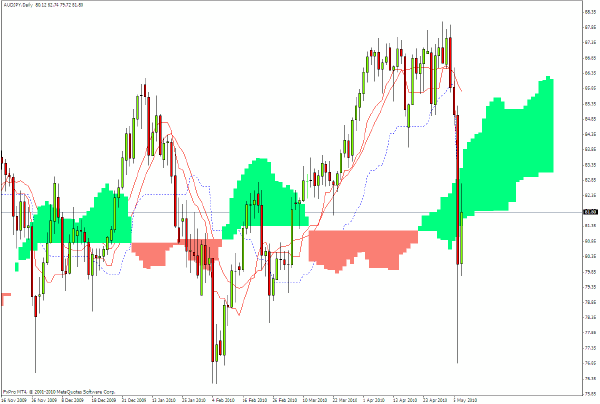
The one immediately below shows yesterday’s dramatic action in the S&P 500 e-mini contract for June and the one below that shows the cross rate trading between the Australian dollar and the Japanese yen.
It is because of the remarkable similarity in their formation that those, whose understanding of capital markets and determining fundamental valuation is derived primarily from mainstream academic texts in finance and portfolio construction, will find the inter-market dynamics revealed yesterday to be so baffling and incromprehensible.
US equity markets had an attack of bipolar meltdown yesterday in afternoon trading in New York, but a lot of the background to this abandonment of all calm and rationality was already at work in the forex markets from earlier on during the European session where trading was very loose and erratic.
The charts in a nutshell highlight the massive role of the FX carry trade and in particular the panic-driven unwinding by some very large quant funds that were positioned wrongly.
The S&P 500 skirted with limit down moves and, as can be seen on the chart, the lows of February around 1040 provided the bottom of the bungee jump.
My own suspicion is that, after a day like yesterday, which most resembled October 1987 of any trading day I can recall, there should be a very long pause for reflection on systemic risk. Having said that, there are many individuals who will want to present the great values in the market and what a wonderful buying opportunity has been created.
As one of my favorite websites - zerohedge.com - showed recently a better text for many market practitioners to be reading is (facetiously of course) Quantitative Ponzinomics for Dummies .

The daily chart for $AUDJPY looks very similar to the one above - and just to spell out what is revealed - there was a major slump in the Australian dollar accompanied by a massive rally in the yen. This is not the kind of behavior that is to be welcomed by hedge funds who have big positions in the FX carry trade and the severity of the move, which coincided with the move in the S&P 500 as shown above, strongly suggests that some large quant funds were having to do some major position adjustment as a result of/ (cause of?) yesterday’s panic.
Just one final comment on this - my own intuition is that talk of "fat finger" errors which precipitated the crisis yesterday should be treated as a smokescreen excuse designed to disguise, to the retail investors especially, the incredible fragility of the financial economy as presently structured.

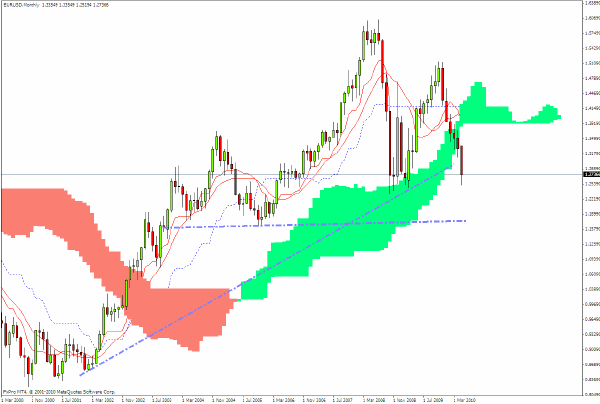
The very long-term chart for $EURUSD shows that a major trend-line has been broken and to cut to the chase I am now projecting a target of $1.18 - in coming months - based on the lines drawn on the chart.
Needless to say there will be bounces and rallies - which will be dramatic - as there are many prop trading desks that are now massively short the euro, but the underlying dysfunctionality of the European Monetary Union - and the risk of its disintegration - should encourage position traders to be ready to sell any significant rallies.

Completely over-shadowed by yesterday’s movements in global capital markets was the election that took place on some rainy islands in the North Atlantic.
On the one hand in the markets we are facing the clash between a tightly coupled financial system - which has very little capacity to withstand crises and on the other hand in the case of the UK election we have an archaic electoral process, an unwritten constitution and no defined procedure for sorting out a messy election result.
Instead of politicians blaming markets for all of the world’s woes they should sort out a lot of the nonsensical nature of our political structures/processes - including the EZ framework- rather than playing populism to try to shift blame on to demonic short sellers etc.
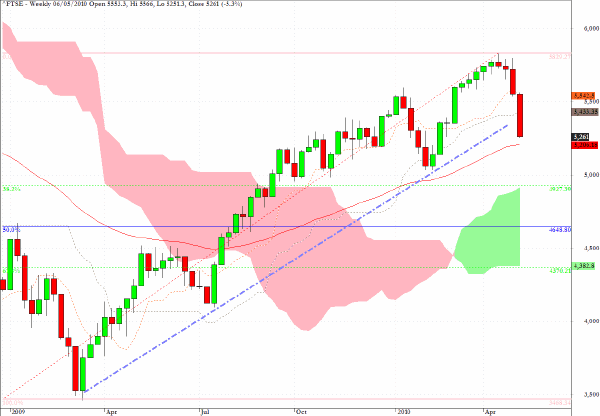
The FTSE 100 looks set to head into the cloud formation on the weekly chart. One of the fascinating features of the chart is that the top of the cloud corresponds to the 38% retracement of the swing high/low since March 2009 and the bottom of the cloud corresponds to the 62% retracement- which I find to be uncanny.
I would suggest that the 50% retracement level - which sits, of course, in the middle of the cloud at 4648 -should be considered as a feasible target in the intermediate term.

Clive Corcoran is the publisher of TradeWithForm.com, which provides daily analysis and commentary on the US stock market.
|