| Corcoran Technical Trading Patterns For May 12 |
| By Clive Corcoran |
Published
05/12/2010
|
Stocks
|
Unrated
|
|
|
|
Corcoran Technical Trading Patterns For May 12
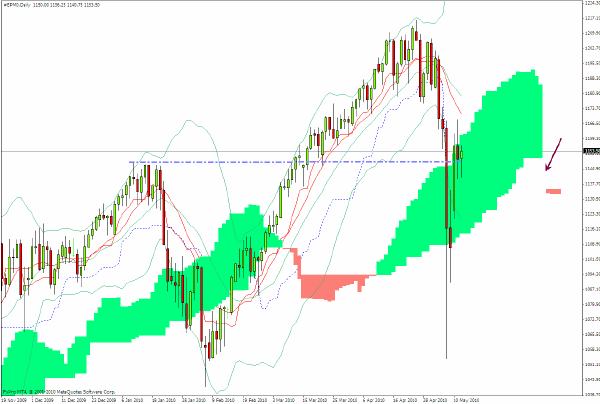
The daily Ichimoku chart of the S&P 500 shows that the 1150 level is proving to be a strong attractor while the markets attempt to digest the implications of last week’s dramatic intraday plunge and the EZ rescue package, as well as signs that Asian and emerging markets in general may be less appealing to global asset allocators.
I am not that keen to play in the near term in the US equities arena but my intuition is that in coming sessions the market is going to have to explore the downside further to see just how much technical damage was done on May 6.
Interestingly, the far right hand side of the chart reveals the large gap in the cloud continuation platform which results from the action last Thursday.
The political landscape is changing in Europe - and not just in the UK. The consequences that flow from the rescue package which was put together for the euro will require, if they are to be successful and the EMU is to survive, a new infrastructure for the EZ area and quite possibly for the EU as a whole.
This will pose immediate problems for the new Con Dem coalition in the UK where the two parties have almost diametrically opposed views regarding further European integration.
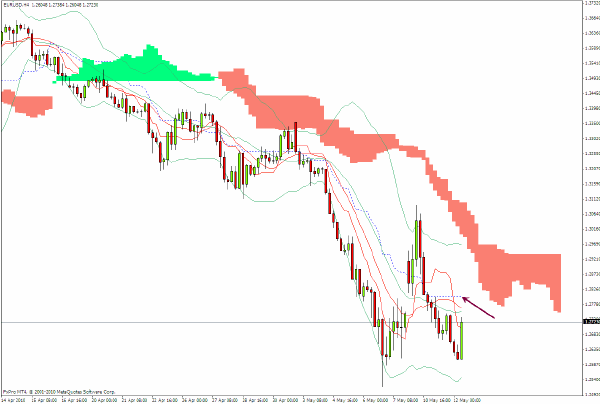
$EURUSD looks set to retest the low just above $1.25 registered on May 6 and on the upside it appears increasingly likely that the Kijun Sen level at $1.28 (indicated by the arrow on the chart) could prove strong resistance - and beyond that the cloud base.
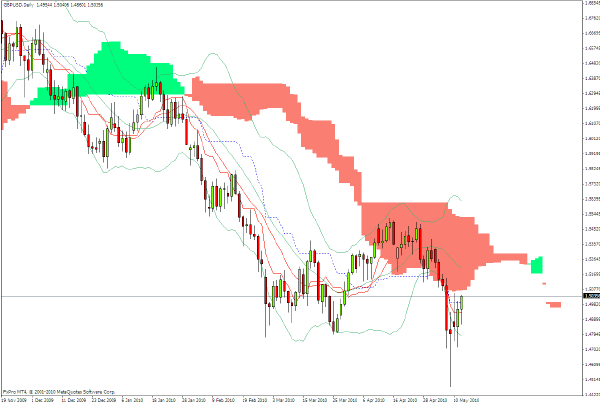
$GBPUSD bounced in the last 24 hours due to a resolution of what was beginning to look like a potential constitutional crisis for the UK.
During the writing of this column sterling has dropped back from $1.50 to almost $1.49 and I would expect the behavior to be erratic over the next few sessions as details of the coalition pact emerge.
The $1.45 level would appear to be in need of a retest but I would suggest that intraday scalping would be the best strategy for now with a bias towards fading rallies.
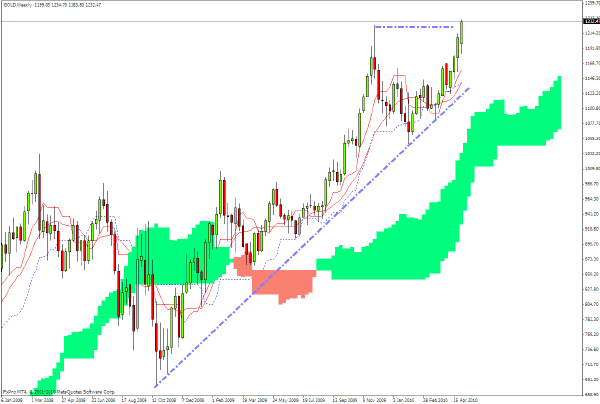
Spot gold is at $1247 in European trading and is on a roll. This must be disconcerting to Eurocrats and especially Messrs Trichet and King - central bank governors in Frankfurt in London.
The targets above $1300 which were discussed here last October are now in play but a steady nerve is recommended as there could be big whipsaw movements ahead.
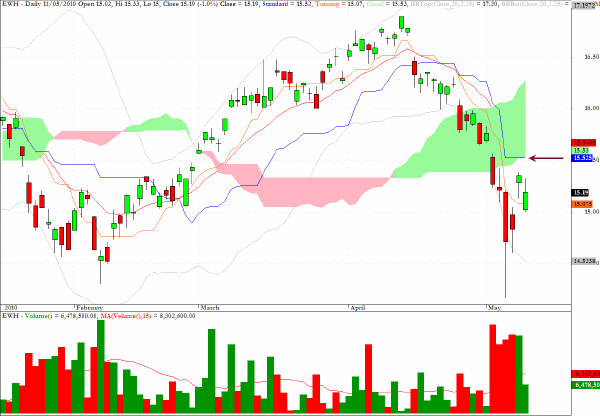
EWH, an exchange traded fund which provides exposure to the Hong Kong market, looks vulnerable to further setbacks as it approaches the cloud formation from below.
On a related note, it is also worth pointing out that the Shanghai Composite Index is substantially below its 200-day EMA, but even more significantly the 50-day EMA is on the verge of crossing the 200-day EMA from above - which makes it the converse of the so-called "Golden Crossover".
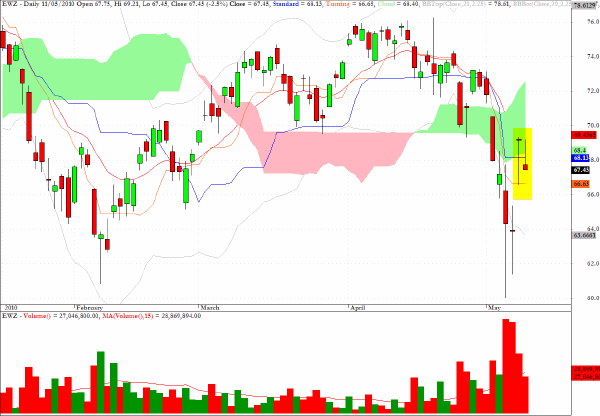
EWZ, which tracks the MSCI Brazil Index has candlestick patterns registered over the last two sessions that are rather intriguing. Monday’s action shows a clear hanging man pattern and yesterday’s pattern shows an inverted hammer. This suggests a real stand-off between the bulls and the bears and reflects the indecision that is being seen across the board in the capital markets following last Thursday’s huge intraday moves.
I suspect that the fund will continue to behave erratically and would be looking at an entry on the short side at the $70 level.
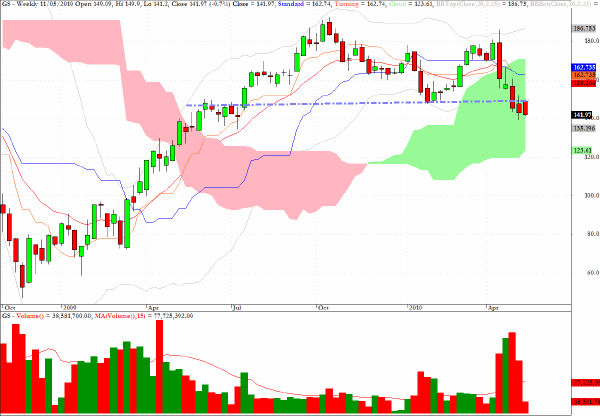
The weekly chart for Goldman Sachs (GS) suggests that the $147 level which had previously provided a line of support may now be shaping up as a line of resistance.
Clive Corcoran is the publisher of TradeWithForm.com, which provides daily analysis and commentary on the US stock market.
|