NASDAQ COMMENTARY
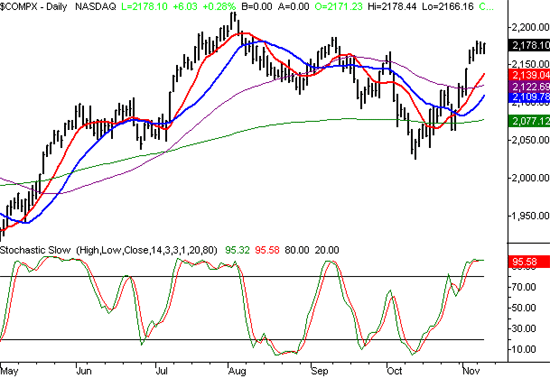
After rocketing to 2144.31 last Wednesday, and then tacking on a huge bullish gap the very next day, the buyers are starting to grow weary again. We made a couple more days worth of mild progress after that, but the last two days have been spent on our heels. So far for the day, we've seen a lower low and a lower high, although we're up as of right now. So, in a sense, we're right at the tipping point. Throw in the fact that there really isn't a floor near the current level of 2168, and the next most likely course of action is a small dip. The key word, though, is 'small'.
The basic scenario is this - the NASDAQ got a little ahead of itself last week, and is now being reeled in. It happens. After reaching 2182 on Monday, the buyers looked back and realized how far away the index had been separated from all of the key moving averages. Crossing above them was bullish for sure, but moderation is the key to longevity. The trip back down to the current reading still leaves the index 30 points above the 10 day line. We expect to see the NASDAQ brush its 10 day line again before making any further progress.
Not surprisingly, a fall back to the 10 day line would also close last Thursday's gap. Considering that 9 point gap was keeping a bunch of buyers out of the game, seeing it closed will actually be a bullish event; it will give all of them a 'second chance' to get in.
After that, we anticipate the NASDAQ restarting the trek higher, accommodating all the theorists that are looking for the traditional year-end rally (which includes us). The first checkpoint, however, is still this year's high near 2220.
NASDAQ CHART - DAILY

S&P 500 COMMENTARY
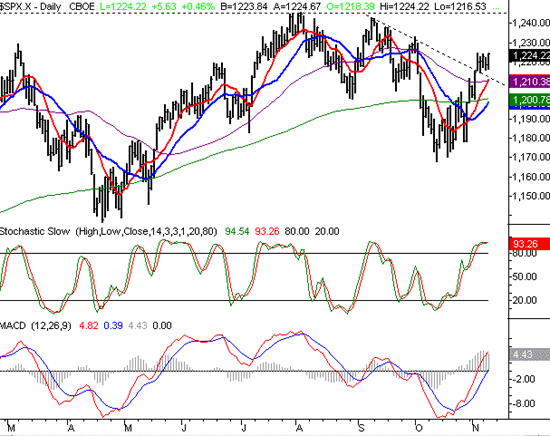
Like the NASDAQ, the S&P 500 really hasn't done much since last week's surge. Well, with the exception of moving above all of its key moving averages, it hasn't done much. Normally such a crossover would be bullish, but as we've seen this year, it really doesn't mean a whole lot in the current environment.
Overall, our trading discipline tells us we have to be bullish. We're a few days into a MACD crossover, and as we mentioned, we just crossed a bunch of major moving average lines. Plus, with the stochastic lines both above 80, the market is in a firm bullish mode (remember, we don't view a stochastic 'overbought' condition as inherently bearish).
However, we still have to acknowledge that this bull trend is far from impressive, or convincing. Like the NASDAQ, the SPX will have a lot more to tell us once the 10 day average is verified (or if) as support. The index is at 1219, while the 10 day line is at 1210. That means we'll need to give up 8 or 9 points between now and then to affirm that support will be found there. That's the only thing that will really give the buyers another blast of confidence.
In the short run, we can see that the SPX is working to get past its recent (last week) high of 1224.70. If we can close above that line, that may be just enough to convince the bulls that we don't need to make a correction (not bring the index all the way back down to 1210) before making another leg higher.
S&P 500 CHART - DAILY

DOW JONES INDUSTRIAL AVERAGE
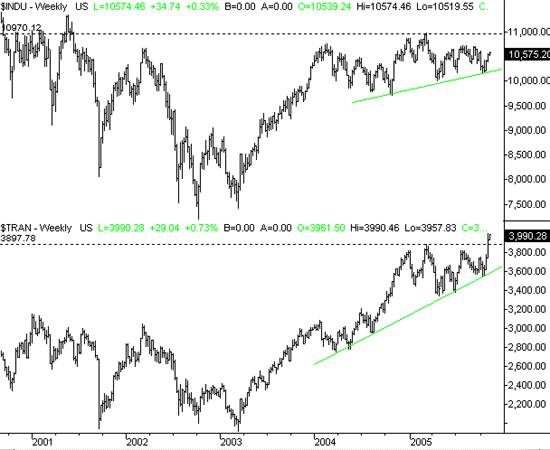
Although the Dow Industrials have been the least impressive piece of the puzzle all year long, the same can't be said about its cousin - the Dow Transportation Average. Although we're traders at heart, any market theory that works is worth studying. We first made reference to the Dow Theory on Tuesday's Daily TrendWatch. But today, we'd like to chart both the Dow Industrials and the Dow Transportation averages so we can really explore what we were talking about (and why it may be a bullish omen).
In a nutshell, the two indexes should move in tandem if a trend is going to continue for any meaningful length of time. When the two move in opposite directions, or even when one moves by itself, reversals are likely. Conversely, when the two move together, they feed on each other's strength.....which creates even more strength.
This became an issue again last week, when the Dow Transportation Average broke to a new 52-week high. According to the theory, the Dow Industrials should follow suit and at least move to new highs as well. If the industrials don't do that, odds are that the transportations bullishness will be short-lived.
The line in the sand for the Dow is around 11,000. Anything less than that, and the long-term bulls should use caution.
Like we said, our focus is on the technicals, but our initial research does indicate that there is some substance to the idea of the Dow Theory, despite the fact that it was developed decades ago. Keep in mind, though, that the transportation stocks have been on a roll for nearly two years, while the industrials have been stagnant for the last two years. It just begs the question of 'how long' until the theory pans out.
DOW JONES INDUSTRIAL AVERAGE CHART

Price Headley is the founder and chief analyst of BigTrends.com.