| The Wagner Daily ETF Report For May 14 |
| By Deron Wagner |
Published
05/14/2010
|
Stocks
|
Unrated
|
|
|
|
The Wagner Daily ETF Report For May 14
Broad market averages were unable to build on Wednesday's momentum, as a quick probe above the prior day's high in the morning session failed to attract much buying interest. After a few hours of choppy action, stocks sold off to new intraday lows in the final hour of trading, with most averages closing near the lows of the day. The small-cap Russell 2000 and S&P Midcap 400 indices both fell 0.9%. The S&P 500, Dow Jones Industrial Average, and Nasdaq Composite dropped 1.0%, 1.2%, and 1.3% respectively.
Total volume was mixed yesterday. NYSE volume finished 7% off Wednesday's pace, while Nasdaq turnover edged 1% higher. Once again total volume came in below its 50-day moving average on both exchanges, which suggests that the institutions have also been in S.O.H. (sit on hands) mode during the bounce off the lows. As we mentioned yesterday, the averages can still push higher on light volume, but the odds of a sustainable rally are quite low without a few heavy volume accumulation days in place.
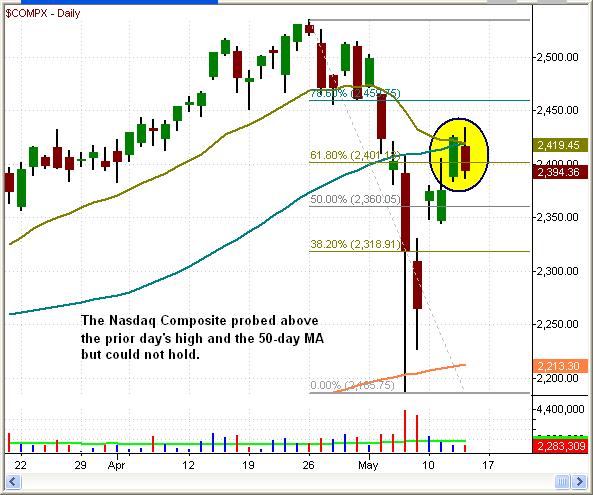
Resistance from the 61.8% Fibo level, the downward sloping 20-day EMA, and the 50-day MA (all around the 2,4000 - 2,425 area) has put some pressure on the Nasdaq Composite. We may see another probe above the 50-day MA if there is no followthrough to the downside over the next few days.
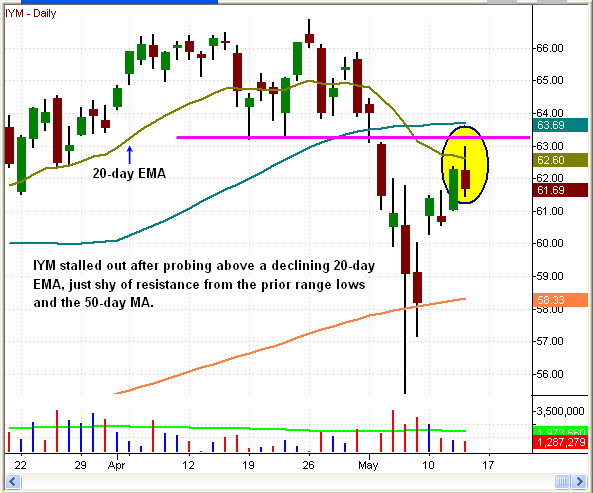
Our existing short position in the iShares Basic Materials Index (IYM) received a little help from the downward sloping 20-day EMA yesterday, as the action reversed nicely after probing above the moving average to close near the lows of the day. We like the bearish price and volume patterns that have emerged over the past two weeks, as the heavy volume selloff is followed by a bounce on declining volume.
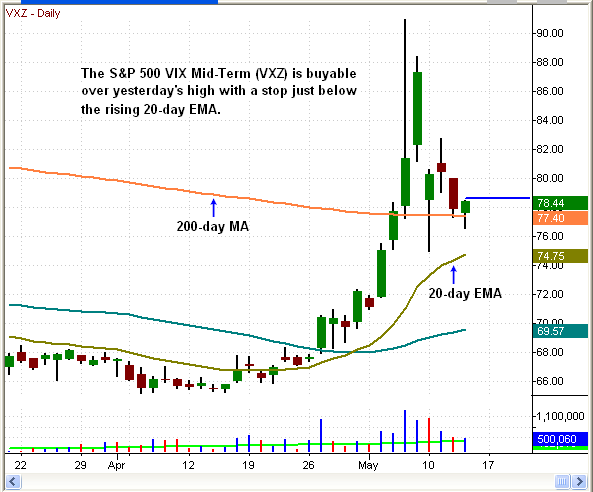
Another way to capitalize on further broad market weakness is by playing the CBOE Volatility Index ($VIX) through the iPath S&P 500 VIX Mid-Term Futures ETF (VXZ). Since VXZ tracks the mid-term months of the S&P 500 VIX futures contract, its performance is better than the VXX, which is focused on the near months. After exploding above the 50-day and 200-day MA's in late April/early May, the price action has settled down and found support at the 200-day MA, and is buyable over yesterday's high.
In yesterday's report we mentioned that the Natural Gas Fund (UNG) is a potential trend reversal candidate above the 50-day moving average for aggressive traders. We also mentioned that a more conservative entry would be to wait for the first pullback to the 50-day moving average after a range breakout. We have a few charts of successful trend reversals below to give us some perspective on a pullback entry off the 50-day MA (we used bar charts so that we could squeeze in more price action).
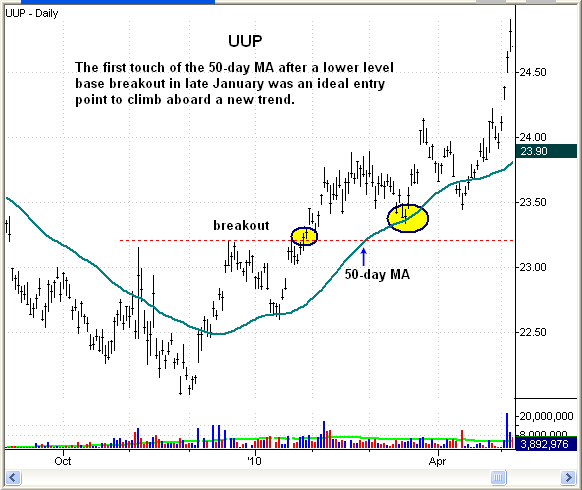
UUP bottomed out from October through January before reversing its downtrend. We clearly see that with a little time and patience there is a low-risk buy entry on the first pullback to the 50-day MA.
The same bottoming action played out in JJC at the beginning of 2009. First we see a lower level base breakout that is followed by an upward sloping 50-day MA. Once a strong uptrend is in place, the first touch of the 50-day MA is once again an ideal low-risk entry point.

The weekly chart below shows how the setup develops on a larger timeframe. Note how the base breakout is followed by a rising 10-week MA. Once the uptrend is in place, the first pullback to the 10-week MA (or 50-day MA on the daily chart) is an ideal buy point.
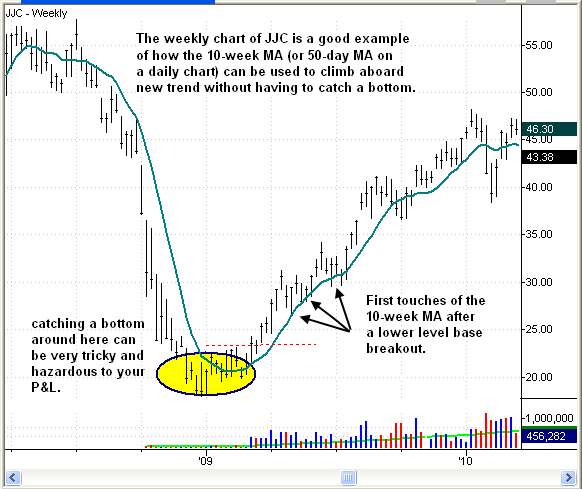
Aggressive traders with strict discipline can buy a lower level breakout in a potential trend reversal like UNG. These type of setups can fall apart quickly until a new uptrend is established, so proper risk management plays a pivotal role. Those traders who have trouble sticking to stops or find that they freeze up when the action reverses should consider using the 50-day MA as an easy entry point. Let's see if the action in UNG over the next few months follows the models of UUP or JJC.
Open ETF positions:
Long -
Short (including inversely correlated "short ETFs") - IWM, IYM
Deron Wagner is the Founder and Head Trader of both Morpheus Capital LP, a U.S. hedge fund, and MorpheusTrading.com, a trader education firm.
|