| The McMillan Options Strategist Weekly |
| By Lawrence G. McMillan |
Published
05/14/2010
|
Options
|
Unrated
|
|
|
|
The McMillan Options Strategist Weekly
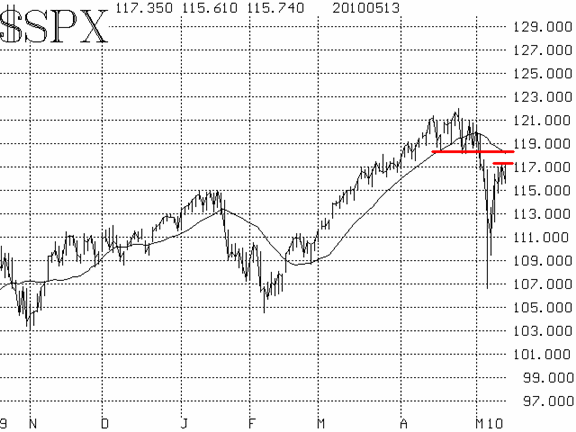
When $SPX broke down below the 1180 level last week, it changed the technical picture from bullish/neutral to bearish. As we will note, there have been several oversold, bullish signals springing up since then, but the most important indicator -- price -- is in a bearish trend. Thus, that dominates our outlook.

There is overhead resistance for $SPX. Today, for the third straight day, $SPX failed at the 1170-1175 zone, and now has fallen back. Thus, the resistance area extends from about 1170 to 1185, and $SPX would have to close above that level in order to reverse itself out of the bearish chart pattern that exists.

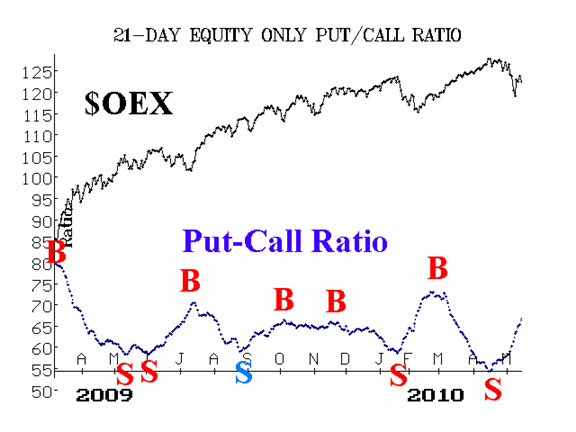
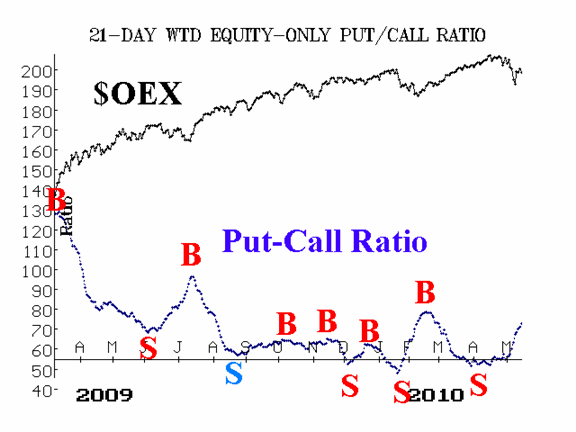
The equity-only put-call ratios remain solidly on sell signals. The breadth indicators declined to very oversold levels last week, and issued buy signals this week, which are still in effect.

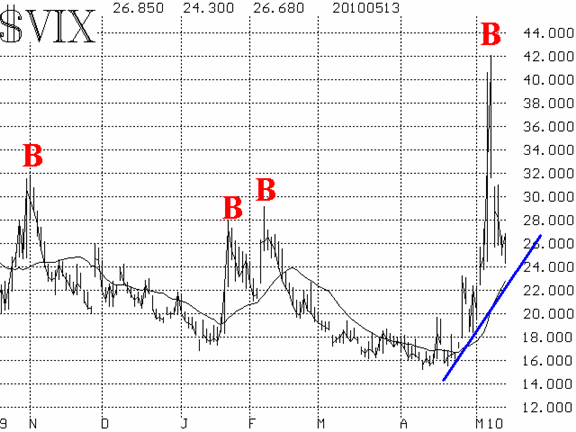
Volatility indices ($VIX and $VXO) spiked upward during the sharp market decline, rising above 40 -- which was quite extreme for what is, to date, only a modest percentage correction in $SPX. They reversed back down this week, forming a spike peak buy signal.

In summary, the signals are mixed. Equity-only put-call ratios, the trend of $VIX, and the $SPX chart are bearish. Positive signs include the spike peak in $VIX and the breadth oscillator buy signals. When signals are mixed, we defer to the price chart of $SPX, and that is now in a downtrend as long as $SPX remains below resistance (1170-1180) and below its 20-day moving average (1185).
Lawrence G. McMillan is the author of two best selling books on options, including Options as a Strategic Investment, recognized as essential resources for any serious option trader's library.
|