| Corcoran Technical Trading Patterns For May 17 |
| By Clive Corcoran |
Published
05/17/2010
|
Stocks
|
Unrated
|
|
|
|
Corcoran Technical Trading Patterns For May 17
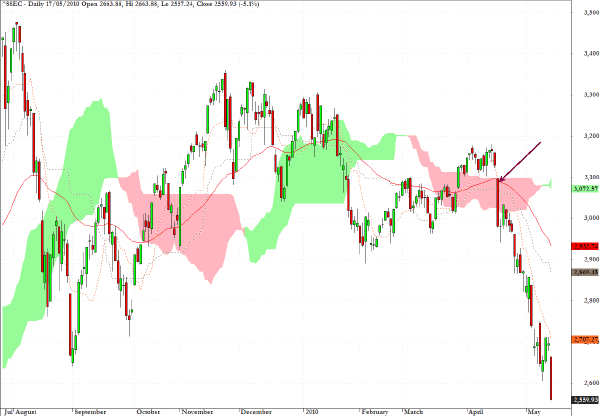
The plight of the euro has taken its toll in Asian trading on Monday, with the largest drop of the major indices being seen in Shanghai where the index dropped by more than 5%.
Indicated with the arrow on the chart is an example of a very reliable sell signal where the Tenkan Sen line crossed below the Kijun Sen within a cloud formation. Signals like this can be found at the Tradewithform website for premium subscribers and here is the link .
There is chart support at the 2400 level and with the index having recently seen a bearish crossover of the 50-day EMA dropping below the 200-day EMA this index may struggle to find a footing before testing this level.
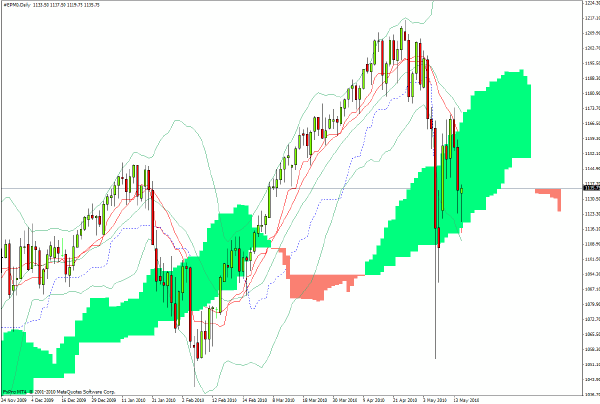
As discussed in Friday’s commentary, the S&P 500 futures needed to explore support in the region of 1130.
The action both in US trading on Friday, and in Asian trading Monday, has seen the index test the bottom of the cloud formation just below 1120 and there is some evidence that support has held.
I would not be surprised to see a rally attempt today when trading opens in the US. The 1150 level should provide a strong layer of resistance with even more above that at 1160.
If the bottom of the cloud support should fail (around 1117) then the next obvious target for the bears would be approximately 1090.
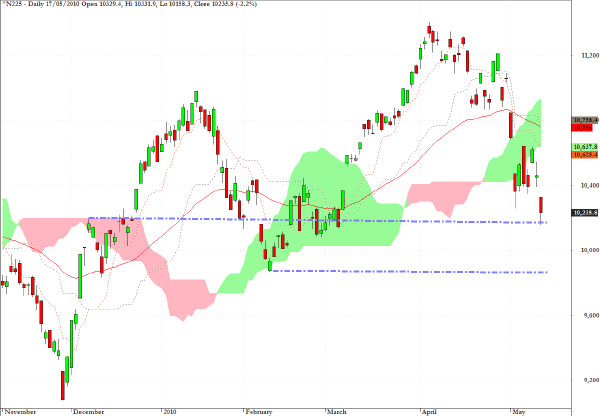
The Nikkei 225 dropped by 2.2% in trading on Monday and has now reached an area of potential chart support with another layer of support at the February low of 9860.
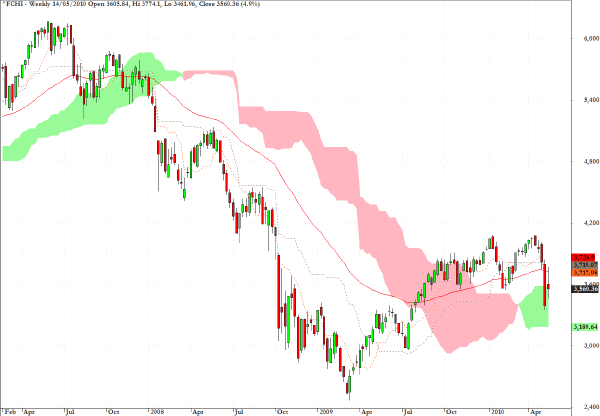
While EMU disintegration and Greek default fears linger, the CAC 40 is one of the more vulnerable large indices in Europe.
A fall to the bottom of the cloud on the weekly chart at around 3200 is now feasible.
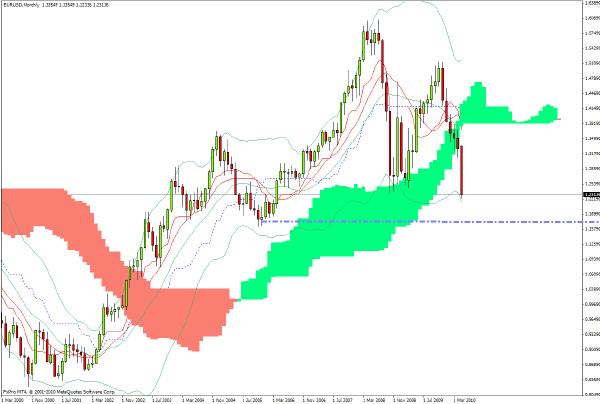
EUR/USD was roughed up again in Asian trading and touched $1.2233. It is showing some signs of stabilizing during European trading and is also outperforming sterling, so short-term scalping moves in EUR/GBP are worth considering during today’s trading.
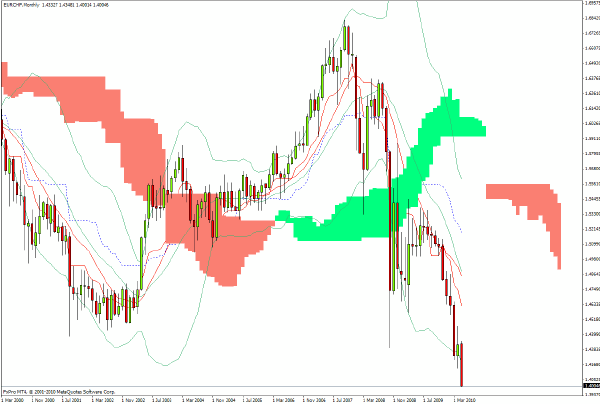
The EUR/CHF pair has been trading at historic lows for the euro with 1.40 being registered in recent sessions.
The Swiss National Bank appears to have abandoned efforts to "manage" the cross rate, but if there are signs that the euro may be forming a temporary base, there could be intervention which would push this rate up quite abruptly.
These were my comments in Friday’s column.
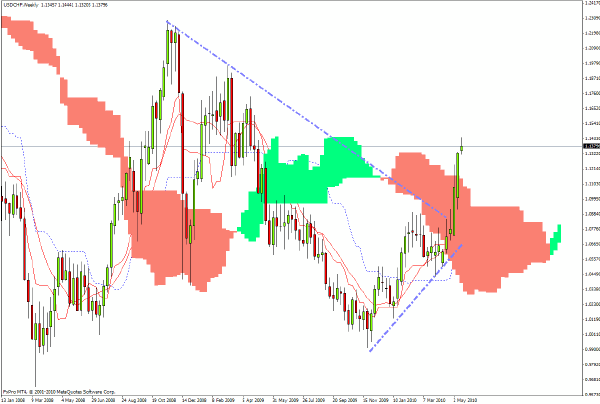
USD/CHF was a focus currency pair earlier this year in these columns where I discussed my view that in broad terms a strengthening of the US currency was to be expected in 2010.
Reviewing the weekly chart, the pair is about to emerge from the weekly cloud formation which validates further bullish action for the US currency. The 61.8% retracement of the swing high/low which is in the vicinity of 1.14 and has been indicated, is a valid intermediate term target.
I did not expect us to hit 1.14 as soon as we have - the pair actually touched 1.1440 in Asian trading today.
There may be scope for further increases as the euro struggles, but I would be looking to ease up on outright long US dollar exposure this week.
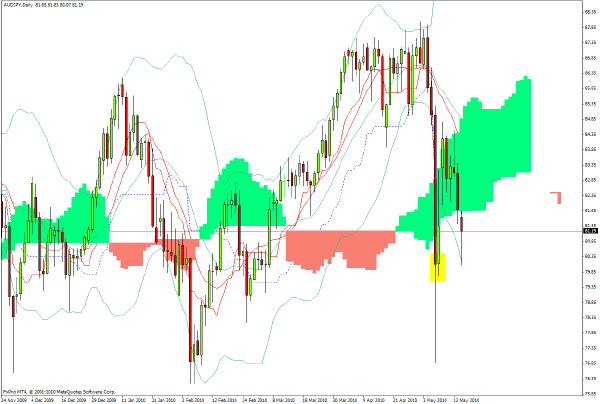
AUD/JPY is still showing a lot of intraday volatility and I will be watching closely at the outcome if there is any testing of the 0.8 level today, as this would provide valuable clues on the risk on/ risk off dynamics which will impact equities as well as commodities.
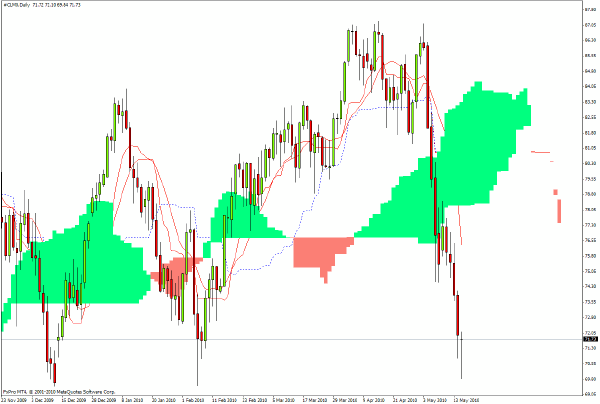
The June WTI contract has dropped below $70 over the last 24 hours and should be monitored today for any evidence that a bounce off a triple bottom could play out in trading during the New York session.
Clive Corcoran is the publisher of TradeWithForm.com, which provides daily analysis and commentary on the US stock market.
|