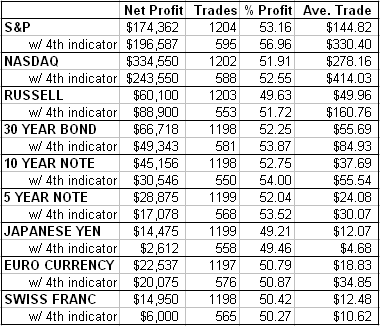
In the last several postings, we've identified basic market biases and how they can be combined into even better performing compound indicators. To recap, the following suggests buys (and the opposite would be sells).
1. The previous close is above the 40-day moving average close.
2. The 2-day moving average is above the 5-day moving average.
3. The highest close of the last 50 days occurred before the lowest 50-day close.
By going in the direction of the majority, we get signals pretty much every day. Positive results were obtained in all the financials we looked at. Then we converted the indicator into a less-than daily signal by adding a fourth component (4) â€" the relationship of the close to the previous range and the average 10-day ranges. Specifically, the fourth indicator was that if today's range is less than the average 10-day range (including today's), then buy the open if today's close was higher than yesterday, or sell short the open if the close was lower.

Four indicators caused some net neutral days which explains the decrease in trades. Still in most markets, the average profit per trade dramatically improved.
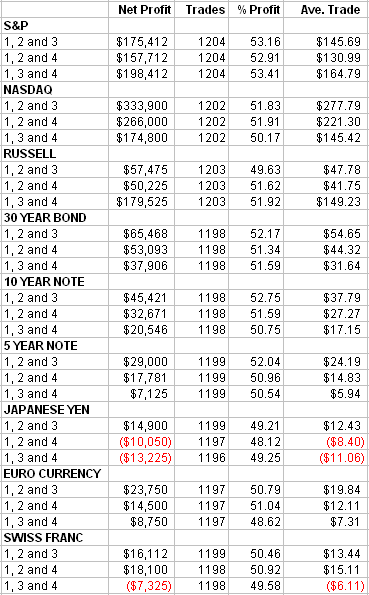
As is usually the case, the test can be modified in a myriad of ways. Here's one. What about the other combinations of three indicators only. In other words, what happens if you throw out first or second indicator rather than the fourth? This is a pretty valid question because it explores the different ways we can devise once-a day entries for every trading day.
Here are the different three out of four results: The numeric notations correspond to the above order.

Clearly, the individual parts are all holding up their end, which is why we got such encouraging figures when we combined all four in our last posting.
Art Collins is the author of Market Beaters, a collection of interviews with renowned mechanical traders. He is currently working on a second volume. E-mail Art at artcollins@ameritech.net.