| Corcoran Technical Trading Patterns For May 18 |
| By Clive Corcoran |
Published
05/18/2010
|
Stocks
|
Unrated
|
|
|
|
Corcoran Technical Trading Patterns For May 18
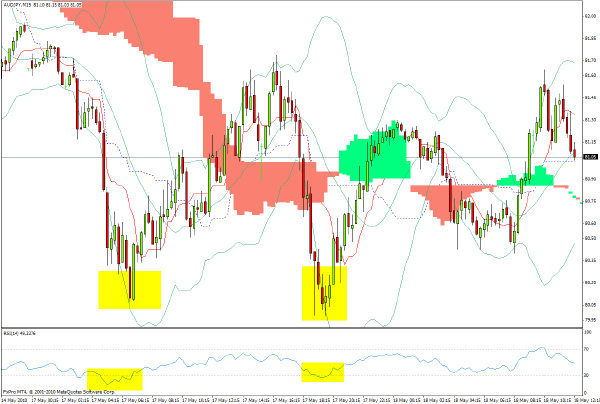
In yesterday’s commentary I discussed the critical level of 80 on the AUD/JPY cross rate and how I would be monitoring it for clues as to market direction if, and when, it was approached.
As the 15-minute chart below reveals, the 80 level was touched twice in yesterday’s trading, and the second time, during the early afternoon session, there was evidence of a positive divergence on the RSI and another proprietary indicator which I use, and this provided a good signal that the 80 level would hold.
Subsequently equities made a rather abrupt V-shaped recovery and there was a softer tone to the dollar.
I would suggest that this pattern should be on your watch list throughout the next few sessions.
Signals based upon Ichimoku patterns can be found at the Tradewithform website for premium subscribers and here is the link .

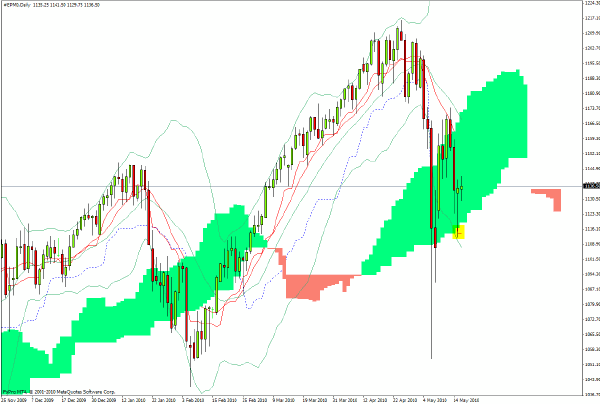
The S&P 500 dropped abruptly soon after the open yesterday and actually pierced below the daily cloud formation and if the cross rate level just discussed above had not held this would have been a good sell signal.
As just discussed, the 80 level held on the key FX carry trade pair, and this provided the cue to get long the index. A rather sharp V-shaped rally ensued and the Armageddon traders will have to wait for another day to realize their moment of revenge.

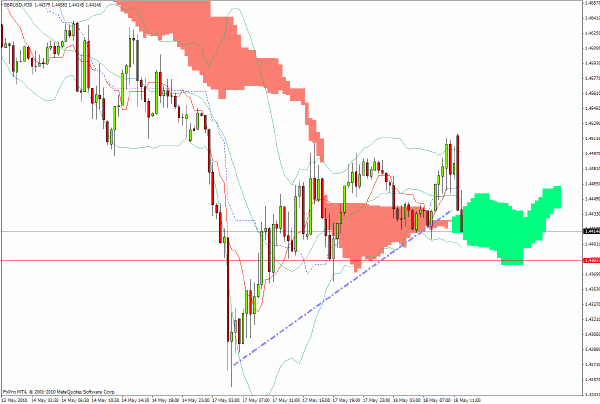
Action in GBP/USD looks rather bearish and the 30-minute chart which was captured at around 10.30 am in European trading on Tuesday shows a violation of a key trendline.
Support may be found at the red line on the chart around $1.4380 but if that fails then a re-visit to recent lows becomes a viable target.

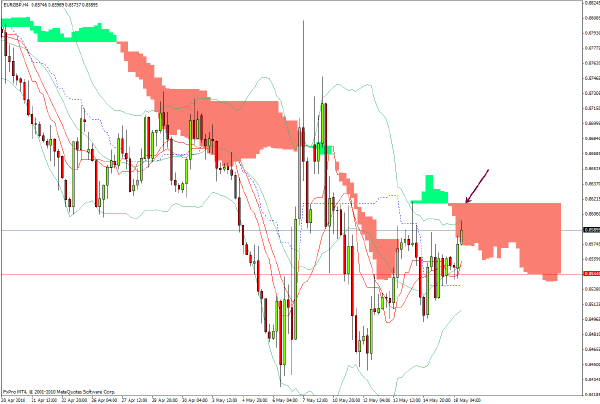
As touched on in yesterday’s commentary, EUR/GBP turned out to be a profitable trade on the long side over the last 24 hours, but the cloud formation on the 4-hour chart suggests the 0.8620 may be a good place to fully scale out of this positioning.

Clive Corcoran is the publisher of TradeWithForm.com, which provides daily analysis and commentary on the US stock market.
|