| Corcoran Technical Trading Patterns For May 19 |
| By Clive Corcoran |
Published
05/19/2010
|
Stocks
|
Unrated
|
|
|
|
Corcoran Technical Trading Patterns For May 19
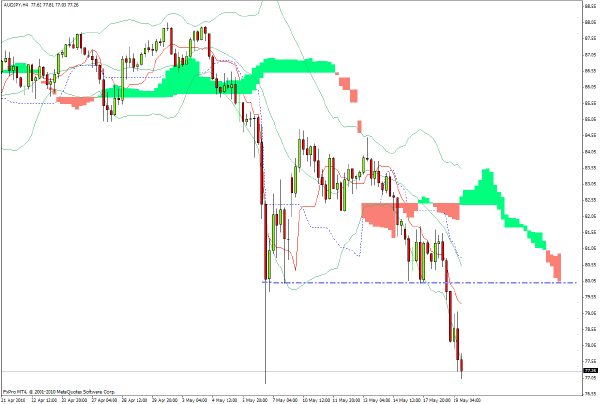
I am cautiously monitoring the $AUDJPY rate as it approaches the May 6 intraday low which was registered just below 77. At the time of writing the cross rate is 77.10 and the momentum to the downside is accelerating.
Just the fact that the 80 level has been substantially breached itself makes the outlook for risk assets, in general, distinctly unfavorable. If the yen continues to strengthen against other FX carry trade currency favorites, there is an increasing likelihood of market mayhem and disorderly liquidations across a number of asset classes.
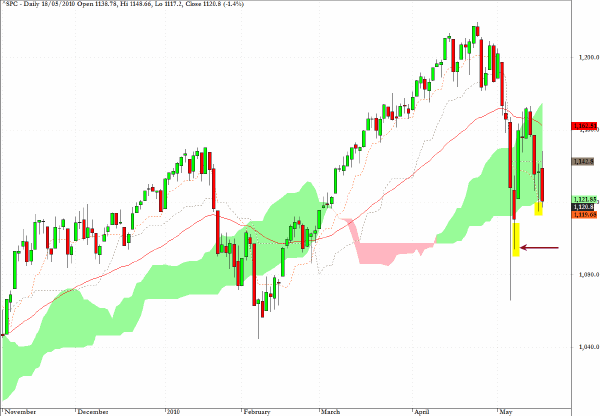
Given the backdrop in the FX carry trade just discussed as well as the bizarre attitude being expressed by Angela Merkel that she welcomes a fight with the markets and is determined to win, I suspect that we could well be looking at a test of the 1094.15 level on the S&P 500 cash index in coming sessions at least.
The large intraday "crash" from May 6 no longer looks like an aberration but, strangel suggests a forward-looking market that uncannily may have been discounting the possibility that the second most traded global currency could be coming apart at the seams. If it does, and in some ways this would be the preferred solution for not only the Club Med countries but also for Germany, it will once again highlight the folly of our belief in the robustness of the creations of financial technocrats. A monetary union without a fiscal union lacks credibility and it may, in years to come, be seen as remarkable that, with only a 10-year track record, so many placed so much faith in the Eurozone arrangements.
On the other hand, when I remove my Armageddon hat, which has a nasty tendency to appear on occasion (somewhat like Doctor Strangelove’s salute), there is always the possibility that a new fudge will buy more time for the political elite of Europe to spin some new schemes for European unification. If, as in the past, European voters give the wrong answers when asked in a referendum about further integration, they simply hold additional referendums until they get the right answer.
But maybe next time it will be different.
The commentary on the cable rate $GBPUSD from yesterday proved to be uncannily accurate. Here is the comment again.
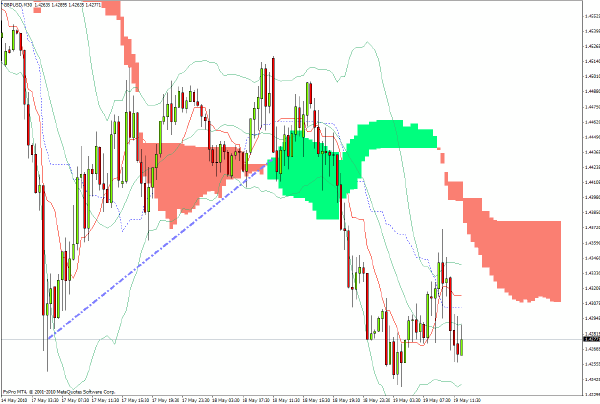
Action in GBP/USD looks rather bearish and the 30-minute chart which was captured at around 10.30 am in European trading on Tuesday shows a violation of a key trendline.
Support may be found at the red line on the chart around $1.4380 but if that fails then a revisit to recent lows becomes a viable target.
As can be seen the tipoff to being able to realize more than 200 pips on this rate was the break of the trendline which was indicated in yesterday’s analysis.
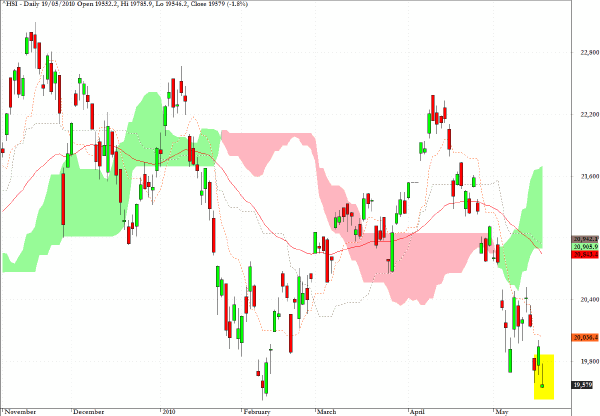
The Hang Seng Index has returned to its February low level. Today’s candlestick shows an interesting formation that would properly be called a gravestone doji if it was at or near to a multi-period high.
The attempt to rally after a severe downward opening gap met with strong rejection and the index closed more or less where it opened and near to its low for the session.
EWH which has been recommended here, on recent occasions, as an ETF for the short side could also have delivered substantial profits if at least part of the position had been retained, since suggested.
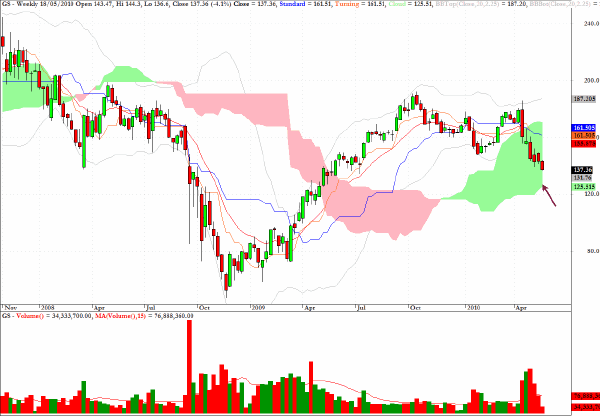
On the weekly chart the Ichimoku cloud suggests $125 as an intermediate-term target for Goldman Sachs (GS). Interestingly in these somewhat apocalyptic times the intermediate term sometimes arrives a lot sooner than one thinks.
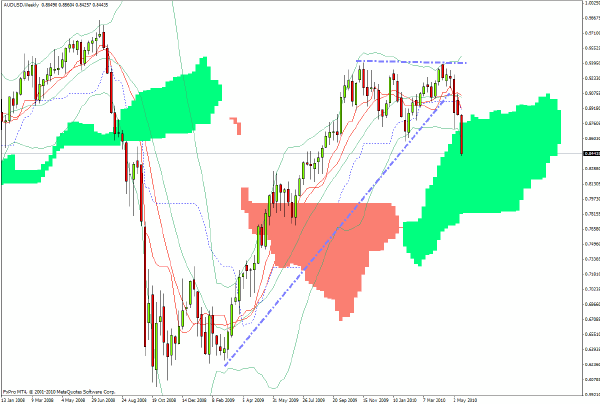
AUD/USD has clearly entered a serious correction after the topping evidence which has been alluded to in this column for some time.
I would not be aggressive on the short side at present but would certainly be looking at any significant rally efforts as an opportunity to re-sell the pair.
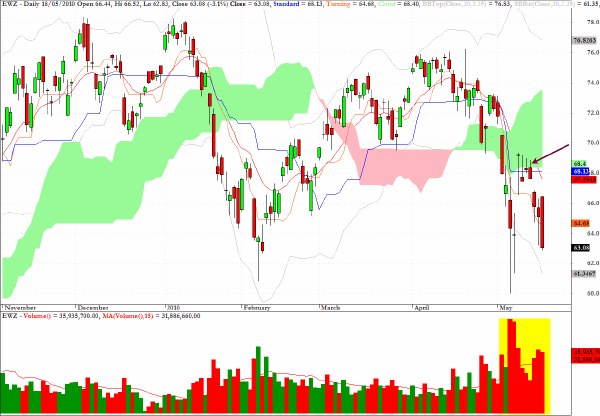
EWZ, which tracks the MSCI Brazil Index, continues to fall after failing to regain a foothold above the base of the cloud (as indicated by the arrow on the chart) and this fund, which was also recommended here some time ago for the short side, seems likely to test the May 6 intraday low in the vicinity of $60.
In all we have already seen a 20% plus correction in this key BRIC index and the notable volume bars show that there has been a lot of long liquidation taking place as the emerging market mania sucked in a lot of fund managers and retail investors during mid-February to mid-April.
Clive Corcoran is the publisher of TradeWithForm.com, which provides daily analysis and commentary on the US stock market.
|