| The McMillan Options Strategist Weekly |
| By Lawrence G. McMillan |
Published
05/28/2010
|
Options
|
Unrated
|
|
|
|
The McMillan Options Strategist Weekly
The long-awaited oversold rally finally appears to be occurring, so let's see how that affects the intermediate-term indicators, which have universally been on sell signals.
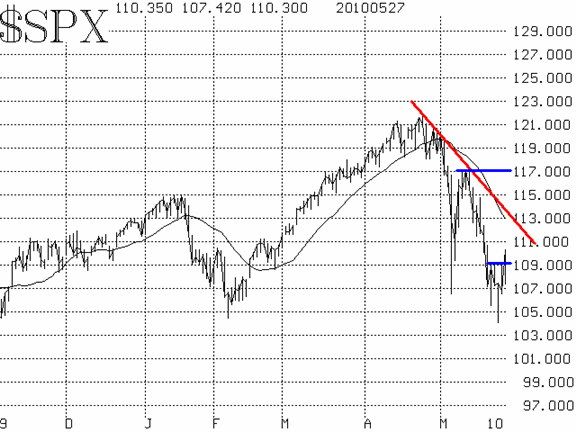
$SPX remains in a downtrend, as there continues to be lower highs and lower lows. Also, the 20-day moving average continues to decline. Thus, its intermediate-term trend is still bearish.

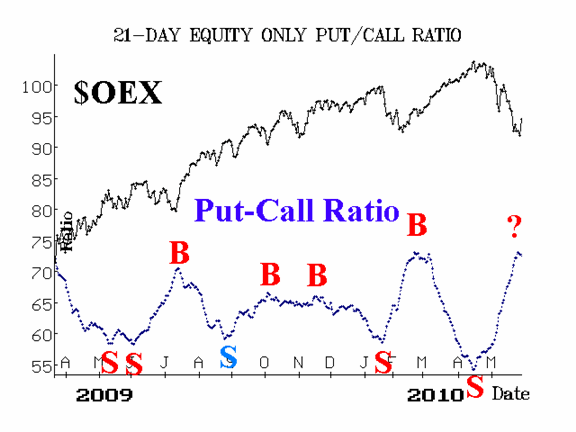
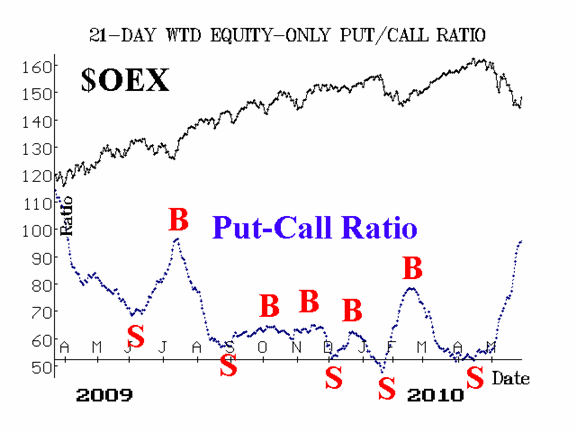
The equity-only put-call ratios have continued to race higher as the selling persisted over the past few weeks. As a result, these ratios have reached a rather high level on their charts, making them oversold. Now, the standard ratio has possibly begun to roll over (see Figure 2). This could be the beginning of a buy signal.

Market breadth had reached extremely oversold levels. Now, breadth indicators could move to buy signals soon.

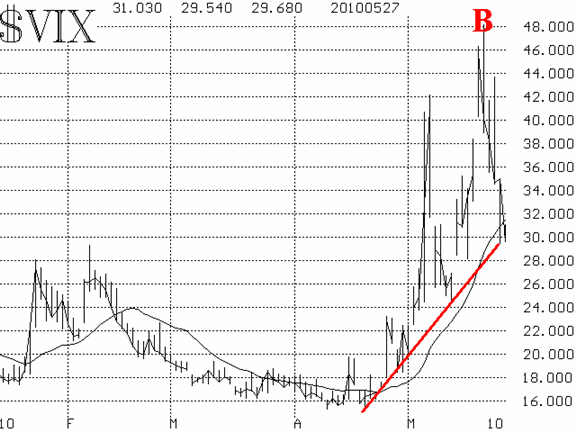
Volatility indices ($VIX and $VXO) spiked upwards a week ago, but that was their peak (at 48, on May 21st). $VIX declined sharply from that peak of a week ago, and that is an oversold buy signal.

In summary, things are taking on a much more bullish tone. The oversold conditions that had become quite extreme have finally spurred the rally we are seeing now. The most bearish indicator, though, is price -- the chart of $SPX. So for now, enjoy the oversold rally. Just don't become married to it.
Lawrence G. McMillan is the author of two best selling books on options, including Options as a Strategic Investment, recognized as essential resources for any serious option trader's library.
|