| Corcoran Technical Trading Patterns For June 1 |
| By Clive Corcoran |
Published
06/1/2010
|
Stocks
|
Unrated
|
|
|
|
Corcoran Technical Trading Patterns For June 1
One of those Ichimoku clouds descended over me last week and I was under the weather.
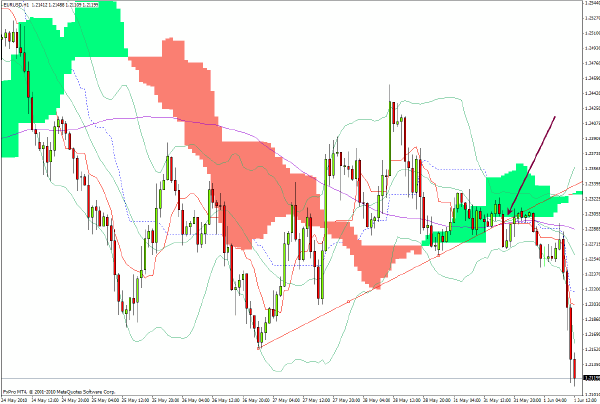
Although absent from my trading desk most of the week and despite yesterday being a public holiday here in the UK and also in the US, there was a very attractive trading opportunity presented in the FX market in the last 24 hours which I posted on my Twitter account Monday afternoon.
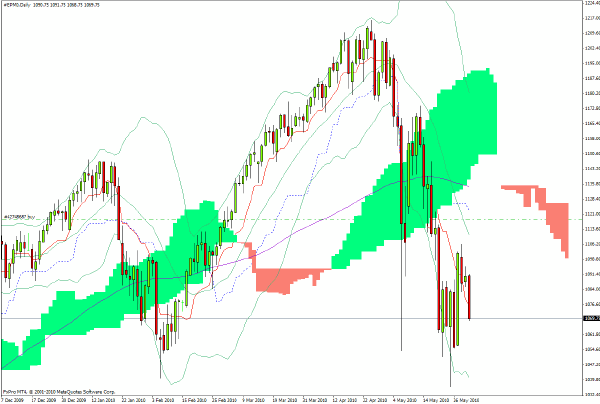
There has been a lot of commentary in the last few days about the alleged appearance of a developing Head and Shoulders pattern on the S&P 500 Index.
Here’s another perspective on key levels on the S&P 500 cash index and, to declare my interest up front, I take a rather agnostic position with respect to H&S patterns. Even though the pattern template seems to be less easily discernible than is often suggested in TA text books, there does seem a good case for using the notion that the size of a correction will often equal the distance from a multi-period top to a key support line (could be called a neckline).
The critical support level from Feb 5, 2010 on the S&P 500 was actually 1044.5 - the intraday low.
Since then we have always managed to close above this level, even during this recent correction.
So we have about 175 points head room up to the April top and if we subtract 175 from 1045 it puts us at 870 which is probably the most important level for the whole period from the March 2009 low onwards and the level which was keenly tested in early July 2009.
It would seem to me that whether or not a right shoulder forms (which could take us back to 1130/50 or thereabouts) or whether another sovereign debt/FX crisis takes us below 1040 on a closing basis in a shorter time frame and more abrupt fashion, there is a growing probability that we will need to revisit the 870 level again in the next 12 months.
Also 875 is the 62% retracement of the swing low of 666 and the high of 1220.
The fundamental story behind such a technically driven move (should it occur) would most likely coincide with a lot of talk about a global double dip and the mistakes being made by too many policy makers of bringing in fiscal austerity packages too soon.
Saving the most ominous technical signal to last, on May 25 (i.e. last Tuesday) the intraday low breached the Feb 5 low mentioned above and actually reached down to 1040 (the lowest level since November 2009).
In a pre HFT market environment, it strikes me that this breach could well act as a more immediate anxiety point that would need to be looked at again before the bulls would have confidence to mount a sustained attempt at taking us back in to the 1130-1150 zone.
But HFT algorithms seem to be less anxiety prone than us humans---when things get really scary they just shut down. And that is the new dynamic which produced the flash crash of May 6 and which makes a lot of traditional TA less useful than in the past.
The chart for June S&P 500 e-Mini futures suggests that trading in North America when it opens later today should see a large drop on the open and perhaps a flash crashette event with all of the associated drama.
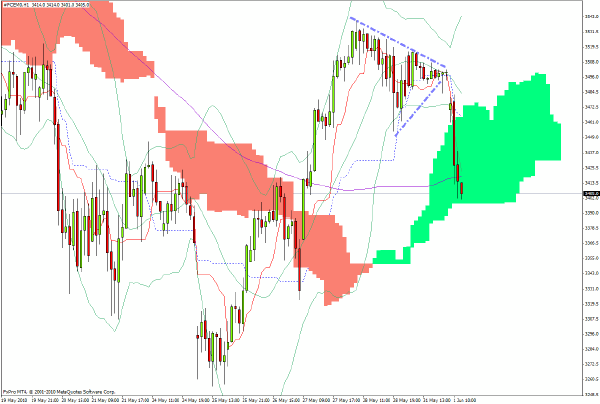
June futures on the CAC 40 index in France are showing that the European markets are starting the month of June on a sour note with, once again, the French market in the vanguard on the downside.
The bottom of the cloud formation suggests that the selling may find a near-term respite soon but the intermediate term projection made here recently of a return to the 3200 level still seems applicable.
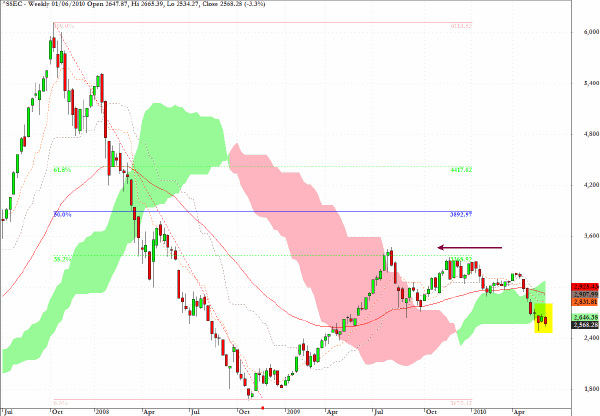
The Shanghai Composite dropped almost one percent in Asian trading.
The long-term weekly chart below reveals how the index effectively failed at the 38% retracement of the large scale swing high/lows shown on the chart and it is hard to get too inspired that this market is about to provide leadership for global equity markets any time soon.
My two cents worth on a lot of the macro calls being made by cheerleaders that the economic fundamentals are improving and that a major rally lies ahead is that they fail to distinguish adequately between the financial economy and the real economy (i.e. the trade in goods and services (not financial)).
The global financial system is sick and needs an extended period of convalescence or it will suffer from a major cardiac arrest. The plight of central banks is that they are running out of options to provide the right kind of intensive care and meanwhile the hapless private sector bankers are still running the asylum.
Strange isn’t it?
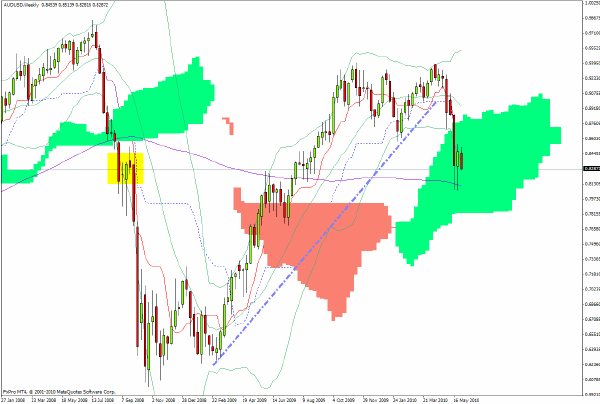
AUD/USD has clearly entered a serious correction after the topping evidence which has been alluded to in this column for some time.
As seen on the weekly Ichimoku charts the key uptrend line from the Feb/March 2009 has been violated and in the longer term targets in the 0.78 region (the base of the green cloud) are now activated.
Also indicated in the highlighted section in yellow there is some price congestion near current levels extending back to the summer of 2008 and I would suggest that if the Aussie cannot maintain some support around current levels we could be headed towards the 0.78 level sooner rather than later.
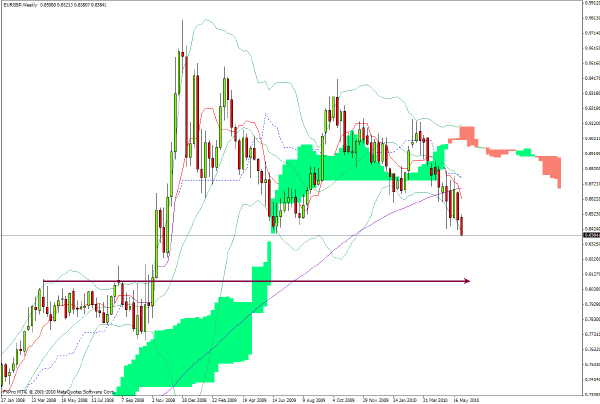
EUR/GBP has taken out key support at 0.84 in trading in Europe this morning.
There really is no major support until one approaches 0.8040 or thereabouts. Good news for correctly positioned FX traders but bad news for the UK economy, for which the EZ is by far its largest trading partner.
Clive Corcoran is the publisher of TradeWithForm.com, which provides daily analysis and commentary on the US stock market.
|